FreeQAs
 Request Exam  Contact
  • Home
  • View All Exams
  • New QA's
  • Upload
PRACTICE EXAMS:
  • Oracle
  • Fortinet
  • Juniper
  • Microsoft
  • Cisco
  • Citrix
  • CompTIA
  • VMware
  • ISC
  • SAP
  • EMC
  • PMI
  • HP
  • Salesforce
  • Other
  • Oracle
    Oracle
  • Fortinet
    Fortinet
  • Juniper
    Juniper
  • Microsoft
    Microsoft
  • Cisco
    Cisco
  • Citrix
    Citrix
  • CompTIA
    CompTIA
  • VMware
    VMware
  • ISC
    ISC
  • SAP
    SAP
  • EMC
    EMC
  • PMI
    PMI
  • HP
    HP
  • Salesforce
    Salesforce
  1. Home
  2. CompTIA Certification
  3. DA0-001 Exam
  4. CompTIA.DA0-001.v2026-02-06.q156 Dumps
  • ««
  • «
  • …
  • 12
  • 13
  • 14
  • 15
  • 16
  • 17
  • 18
  • 19
  • 20
  • 21
  • …
  • »
  • »»
Download Now

Question 76

An analyst is reporting on the average income for a county and is reviewing the following data:
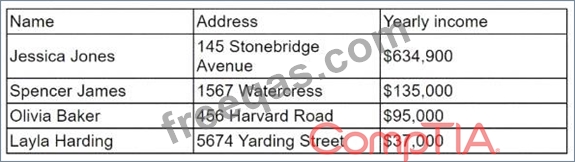
Which of the following is the reason the analyst would need to cleanse the data in this data set?

Correct Answer: C
insert code

Question 77

The director of operations at a power company needs data to help identify where company resources should be allocated in order to monitor activity for outages and restoration of power in the entire state. Specifically, the director wants to see the following:
* County outages
* Status
* Overall trend of outages
INSTRUCTIONS:
Please, select each visualization to fit the appropriate space on the dashboard and choose an appropriate color scheme. Once you have selected all visualizations, please, select the appropriate titles and labels, if applicable.
Titles and labels may be used more than once.
If at any time you would like to bring back the initial state of the simulation, please click the Reset All button.

Power outages

Correct Answer:
Explanation
This is a simulation question that requires you to create a dashboard with visualizations that meet the director's needs. Here are the steps to complete the task:
Drag and drop the visualization that shows the county outages on the top left space of the dashboard.
This visualization is a map of the state with different colors indicating the number of outages in each county. You can choose any color scheme that suits your preference, but make sure that the colors are consistent and clear. For example, you can use a gradient of red to show the counties with more outages and green to show the counties with less outages.
Drag and drop the visualization that shows the status of the outages on the top right space of the dashboard. This visualization is a pie chart that shows the percentage of outages that are active, restored, or pending. You can choose any color scheme that suits your preference, but make sure that the colors are distinct and easy to identify. For example, you can use red for active, green for restored, and yellow for pending.
Drag and drop the visualization that shows the overall trend of outages on the bottom space of the dashboard. This visualization is a line graph that shows the number of outages over time. You can choose any color scheme that suits your preference, but make sure that the color is visible and contrasted with the background. For example, you can use blue for the line and white for the background.
Select appropriate titles and labels for each visualization. Titles and labels may be used more than once.
For example, you can use "County Outages" as the title for the map, "Status" as the title for the pie chart, and "Trend" as the title for the line graph. You can also use "County", "Number of Outages",
"Active", "Restored", "Pending", "Time", and "Number of Outages" as labels for the axes and legends of the visualizations.
insert code

Question 78

What type of regulation is the Payment Card Industry Data Security Standard (PCIDSS)?

Correct Answer: A
insert code

Question 79

Which of the following data sampling methods involves dividing a population into subgroups by similar characteristics?

Correct Answer: A
insert code

Question 80

A county in Illinois is conducting a survey to determine the mean annual income per household. The county is 427sq mi (2.65q km). Which of the following sampling methods would MOST likely result in a representative sample?


Correct Answer: D
Surveys sent to 100 randomly selected homes that are reflective of the population. This is because a random sample is a type of sample that is selected by using a random method, such as a lottery or a computer-generated number, which ensures that every element in the population has an equal chance of being selected. A random sample can result in a representative sample, which means that the sample reflects the characteristics and diversity of the population. By sending surveys to 100 randomly selected homes that are reflective of the population, the analyst can ensure that the sample is representative of the county's households and their income levels. The other sampling methods are not likely to result in a representative sample. Here is why:
A stratified phone survey of 100 people that is conducted between 2:00 p.m. and 3:00 p.m. would result in a biased sample, which means that the sample favors or excludes certain groups or elements in the population. By conducting the survey only between 2:00 p.m. and 3:00 p.m., the analyst would miss out on people who are not available or reachable at that time, such as those who are working or sleeping. This could affect the representativeness and generalizability of the sample.
A systematic survey that is sent to 100 single-family homes in the county would result in an unrepresentative sample, which means that the sample does not reflect the characteristics and diversity of the population. By sending surveys only to single-family homes, the analyst would ignore other types of households, such as apartments, condos, or mobile homes. This could affect the accuracy and reliability of the sample.
Surveys sent to ten randomly selected homes within 5mi (8km) of the county's office would result in a small sample, which means that the sample size is too low to capture the variability and diversity of the population. By sending surveys only to ten homes within a limited area, the analyst would miss out on many households that are located in different parts of the county. This could affect the precision and confidence of the sample.
insert code
  • ««
  • «
  • …
  • 12
  • 13
  • 14
  • 15
  • 16
  • 17
  • 18
  • 19
  • 20
  • 21
  • …
  • »
  • »»
[×]

Download PDF File

Enter your email address to download CompTIA.DA0-001.v2026-02-06.q156 Dumps

Email:

FreeQAs

Our website provides the Largest and the most Latest vendors Certification Exam materials around the world.

Using dumps we provide to Pass the Exam, we has the Valid Dumps with passing guranteed just which you need.

  • DMCA
  • About
  • Contact Us
  • Privacy Policy
  • Terms & Conditions
©2026 FreeQAs

www.freeqas.com materials do not contain actual questions and answers from Cisco's certification exams.