FreeQAs
 Request Exam  Contact
  • Home
  • View All Exams
  • New QA's
  • Upload
PRACTICE EXAMS:
  • Oracle
  • Fortinet
  • IBM
  • Juniper
  • Microsoft
  • Cisco
  • Citrix
  • CompTIA
  • VMware
  • ISC
  • SAP
  • EMC
  • PMI
  • HP
  • Salesforce
  • Other
  • Oracle
    Oracle
  • Fortinet
    Fortinet
  • IBM
    IBM
  • Juniper
    Juniper
  • Microsoft
    Microsoft
  • Cisco
    Cisco
  • Citrix
    Citrix
  • CompTIA
    CompTIA
  • VMware
    VMware
  • ISC
    ISC
  • SAP
    SAP
  • EMC
    EMC
  • PMI
    PMI
  • HP
    HP
  • Salesforce
    Salesforce
  1. Home
  2. IIBA Certification
  3. CBDA Exam
  4. IIBA.CBDA.v2024-07-29.q79 Dumps
  • ««
  • «
  • …
  • 8
  • 9
  • 10
  • 11
  • 12
  • 13
  • 14
  • 15
  • 16
  • 17
  • »
Download Now

Question 71

A private school has decided to include bullet charts in students' end of year performance report. It will depict the student's score against the highest score achieved in that grade, and the qualitative category that the student's score falls under.Should a column chart be used instead?

Correct Answer: D
A bullet chart is a type of bar chart that shows progress towards a goal or performance against a reference line1. It consists of a bar representing the featured measure, a reference line denoting a target or threshold, and a background with qualitative ranges (such as poor, fair, good, excellent)2. In this case, the featured measure is the student's score, the reference line is the highest score achieved in that grade, and the background ranges are the qualitative categories that the student's score falls under. A bullet chart is a good option for this use case because it can display all three criteria in one chart, using minimal space and avoiding clutter. A column chart, on the other hand, would require either multiple columns for each student to show the score, the highest score, and the category, or a separate legend to map the colors of the columns to the categories. This would make the chart less effective in communicating the information and more difficult to compare across students.
References:1: Understanding and Using Bullet Graphs | Tableau, 2: Bullet Charts - What Is It And How To Use It - JSCharting
insert code

Question 72

An analytics team employed at a leading credit card company is utilizing data analytics to identify unusual credit card purchases.
They have created the following visual. How many extreme outliers exists in this dataset?

Correct Answer: C
Explanation
According to the Business Data Analytics (IIBA®- CBDA) principles, extreme outliers in a dataset can be identified visually on a scatter plot as points that are distinctly separate from the bulk of the data. In this visual, there are three points that are significantly higher on the y-axis (credit card expense) relative to their position on the x-axis (household income), indicating unusual credit card purchases. References: The identification and interpretation of outliers is a standard practice in data analytics and is covered under the Business Data Analytics (IIBA®- CBDA) learning resources.
insert code

Question 73

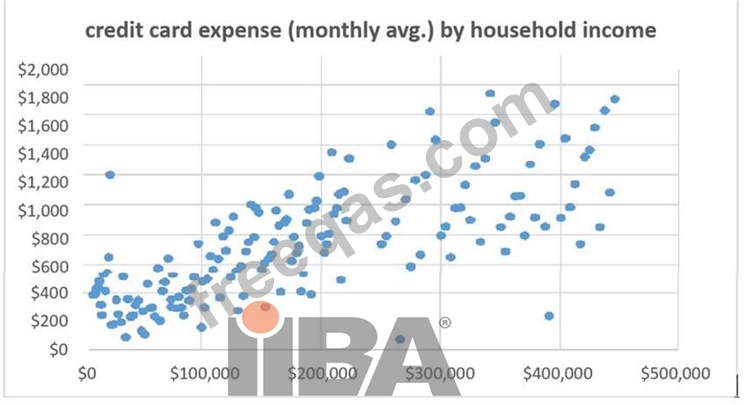
The definition of data elements is different across various data sources. The organization is looking to improve the usability of data across the organization. Which practice would help address this problem?

Correct Answer: A
Explanation
Data governance is the practice of establishing and enforcing policies, standards, roles, and responsibilities for the management and use of data across the organization. Data governance helps to address the problem of inconsistent data definitions across various data sources by ensuring that data is properly defined, documented, classified, and aligned with the business objectives and requirements12. References: 1: Guide to Business Data Analytics, IIBA, 2020, p. 292: Data Governance: How to Design, Deploy and Sustain an Effective Data Governance Program, John Ladley, 2012, p. 3.
insert code

Question 74

The analytics team discovers there is an abundance of data available to them from various sources. They are excited about the potential of turning this data into usable information for their organization.They decide to focus the analytics work on:

Correct Answer: D
According to the IIBA® Guide to Business Data Analytics, analytics work should be driven by well-defined business problems or opportunities that are aligned with the organization's strategic objectives1. Having an abundance of data does not necessarily mean that all of it is relevant, reliable, or useful for the analytics purpose. Therefore, the analytics team should focus on using the data to answer a limited number of key questions that are derived from the business context and that can generate actionable insights and outcomes. This approach can help the analytics team prioritize the most important data sources, methods, and tools, as well as avoid wasting time and resources on analysis that is not impactful or meaningful for the organization.
References:1: IIBA® Guide to Business Data Analytics, Chapter 3: Business Data Analytics Process, page
24-25
insert code

Question 75

Operation managers are concerned about the increasing attrition rates in the call center. A series of interviews is being conducted with call center agents to collect information to better understand the problem.
Interviewees will ask open and closed ended questions that are both quantitative and qualitative. Which of the following is considered a qualitative open-ended question?

Correct Answer: A
Explanation
A qualitative open-ended question is a question that allows the respondent to express their thoughts, feelings, or opinions in their own words, without being constrained by predefined options or categories. A qualitative open-ended question can help the interviewer explore the underlying reasons, motivations, or perceptions of the respondent. Option A is a qualitative open-ended question, because it asks the respondent to explain how call volume affects their job satisfaction and well-being, which may vary from person to person and require elaboration. Options B, C, and D are not qualitative open-ended questions, because they ask the respondent to choose between two alternatives (B and D) or provide a numerical value ©, which are quantitative and closed-ended responses. References:
*Business Analysis Certification in Data Analytics, CBDA | IIBA®, CBDA Competencies, Domain 2: Source Data
*Understanding the Guide to Business Data Analytics, page 14
*CERTIFICATION IN BUSINESS DATA ANALYTICS HANDBOOK - IIBA®, page 8, CBDA Exam Sample Questions and Self-Assessment, Question 9
insert code
  • ««
  • «
  • …
  • 8
  • 9
  • 10
  • 11
  • 12
  • 13
  • 14
  • 15
  • 16
  • 17
  • »
[×]

Download PDF File

Enter your email address to download IIBA.CBDA.v2024-07-29.q79 Dumps

Email:

FreeQAs

Our website provides the Largest and the most Latest vendors Certification Exam materials around the world.

Using dumps we provide to Pass the Exam, we has the Valid Dumps with passing guranteed just which you need.

  • DMCA
  • About
  • Contact Us
  • Privacy Policy
  • Terms & Conditions
©2026 FreeQAs

www.freeqas.com materials do not contain actual questions and answers from Cisco's certification exams.