You need to create a visualization of running sales totals per quarter as shown in the following exhibit.
What should you create in Power BI Desktop?
For each of the following statements, select Yes if the statement is true. Otherwise, select No.
NOTE: Each correct selection is worth one point.

To complete the sentence, select the appropriate option in the answer area.

Match the types of data to the appropriate Azure data services.
To answer, drag the appropriate data types from the column on the left to its service on the right. Each data type may be used once, more than once, or not at all.
NOTE: Each correct match is worth one point.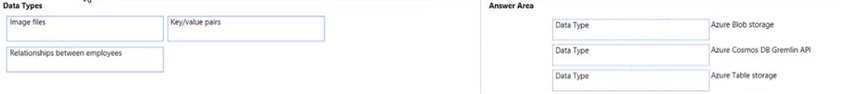

Match the Azure services to the appropriate locations in the architecture.
To answer, drag the appropriate service from the column on the left to its location on the right. Each service may be used once, more than once, or not at all.
NOTE: Each correct match is worth one point.

