FreeQAs
 Request Exam  Contact
  • Home
  • View All Exams
  • New QA's
  • Upload
PRACTICE EXAMS:
  • Oracle
  • Fortinet
  • Juniper
  • Microsoft
  • Cisco
  • Citrix
  • CompTIA
  • VMware
  • ISC
  • SAP
  • EMC
  • PMI
  • HP
  • Salesforce
  • Other
  • Oracle
    Oracle
  • Fortinet
    Fortinet
  • Juniper
    Juniper
  • Microsoft
    Microsoft
  • Cisco
    Cisco
  • Citrix
    Citrix
  • CompTIA
    CompTIA
  • VMware
    VMware
  • ISC
    ISC
  • SAP
    SAP
  • EMC
    EMC
  • PMI
    PMI
  • HP
    HP
  • Salesforce
    Salesforce
  1. Home
  2. Microsoft Certification
  3. PL-300 Exam
  4. Microsoft.PL-300.v2024-03-20.q242 Dumps
  • ««
  • «
  • …
  • 9
  • 10
  • 11
  • 12
  • 13
  • 14
  • 15
  • 16
  • 17
  • 18
  • …
  • »
  • »»
Download Now

Question 61

You have a collection of reports for the HR department of your company.
You need to create a visualization for the HR department that shows a historic employee counts and predicts trends during the next six months.
Which type of visualization should you use?

Correct Answer: C
The best data for forecasting is time series data or uniformly increasing whole numbers. The line chart has to have only one line.
Try forecasting: Try the new forecasting capabilities of Power View today on your own data or with the sample report available as part of the Power BI report samples. To view your own data, upload a workbook with a Power View time series line chart to Power BI for Office 365.
Reference:
https://powerbi.microsoft.com/en-us/blog/introducing-new-forecasting-capabilities-in-power-view-for-office-365
insert code

Question 62

You have a Power Bl query named Sates that imports the columns shown in the following table.

Usees only use the dale part of the Sales.Date field. Only rows with a Status of Finished are used in analysis.
You need to reduce the load times of the query without affecting the analysis.
Which two actions achieve this goal? Each correct answer presents a complete solution.
NOTL Each correct selection is worth one pant.

Correct Answer: C,E
insert code

Question 63

Your company has affiliates who help the company acquire customers.
You build a report for the affiliate managers at the company to assist them in understanding affiliate performance.
The managers request a visual showing the total sales value of the latest 50 transactions for each affiliate. You have a data model that contains the following tables.

You need to develop a measure to support the visual.
How should you complete the DAX expression? To answer, select the appropriate options in the answer area.
NOTE: Each correct selection is worth one point.
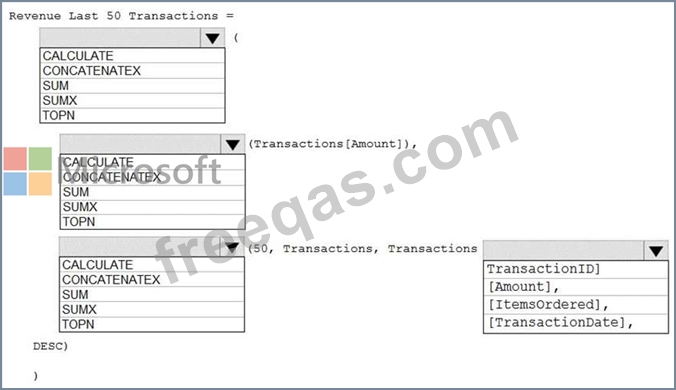
Correct Answer:

Reference:
https://docs.microsoft.com/en-us/dax/topn-function-dax
insert code

Question 64

You need to create a DAX measure in the data model that only allows users to see projections at the appropriate levels of granularity.
How should you complete the measure? To answer, drag the appropriate values to the correct targets. Each value may be used once, more than once, or not at all. You may need to drag the split bar between panes or scroll to view content.
NOTE: Each correct selection is worth one point.

Correct Answer:

Explanation

Scenario: Revenue projections are set at the monthly level and summed to show projections for the quarter.
Box 1: IF
Box 2: ISFILTERED
ISFILTERED returns TRUE when columnName is being filtered directly. If there is no filter on the column or if the filtering happens because a different column in the same table or in a related table is being filtered then the function returns FALSE.
Box 3: SUM
Reference:
https://docs.microsoft.com/en-us/dax/isfiltered-function-dax
insert code

Question 65

You have a folder of monthly transaction extracts.
You plan to create a report to analyze the transaction data.
You receive the following email message: "Hi. I've put 24 files of monthly transaction data onto the shared drive. File Transactions201901.csv through Transactions201912.csv have the latest set of columns, but files Transactions201801.csv to Transactions201812.csv have an older layout without the extra fields needed for analysis. Each file contains 10 to 50 transactions." You get data from the folder and select Combine & Load. The Combine Files dialog box is shown in the exhibit. (Click the Exhibit tab.)

For each of the following statements, select Yes if the statement is true. Otherwise, select No.
NOTE: Each correct selection is worth one point.

Correct Answer:
insert code
  • ««
  • «
  • …
  • 9
  • 10
  • 11
  • 12
  • 13
  • 14
  • 15
  • 16
  • 17
  • 18
  • …
  • »
  • »»
[×]

Download PDF File

Enter your email address to download Microsoft.PL-300.v2024-03-20.q242 Dumps

Email:

FreeQAs

Our website provides the Largest and the most Latest vendors Certification Exam materials around the world.

Using dumps we provide to Pass the Exam, we has the Valid Dumps with passing guranteed just which you need.

  • DMCA
  • About
  • Contact Us
  • Privacy Policy
  • Terms & Conditions
©2026 FreeQAs

www.freeqas.com materials do not contain actual questions and answers from Cisco's certification exams.
