You import a Power Bl dataset that contains the following tables:
* Date
* Product
* Product Inventory
The Product inventory table contains 25 million rows. A sample of the data is shown in the following table.
The Product Inventory table relates to the Date table by using the DateKey column. The Product inventory table relates to the Product table by using the ProductKey column. You need to reduce the size of the data model without losing information. What should you do?
You have a Power BI report that contains the table visual shown in the following exhibit.


You need to create a DAX measure in the data model that only allows users to see projections at the appropriate levels of granularity.
How should you complete the measure? To answer, drag the appropriate values to the correct targets. Each value may be used once, more than once, or not at all. You may need to drag the split bar between panes or scroll to view content.
NOTE: Each correct selection is worth one point.

You are creating a line chart in a Power Bl report as shown in the following exhibit.
Use the drop-down menus to select the answer choice that completes each statement based on the information presented in the graphic.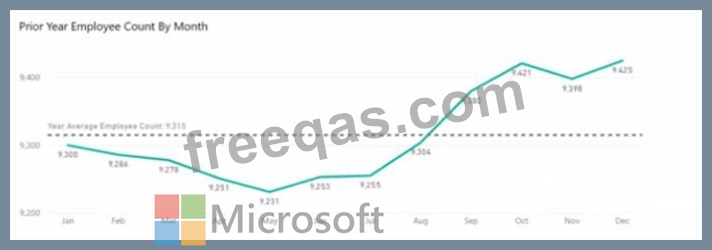
NOTE: Each correct selection is worth one point.

DRAG DROP
You have a Microsoft Power Bl workspace.
You need to grant the user capabilities shown in the following table.
The solution must use the principle of least privilege.
Which user role should you assign to each user? To answer, drag the appropriate roles to the correct users. Each role may be used once, more than once, or not at all. You may need to drag the split bar between panes or scroll to view content. NOTE: Each correct selection is worth one point.


