You are creating a Microsoft Power Bl imported data model to perform basket analysis. The goal of the analysis is to identify which products are usually bought together in the same transaction across and within sales territories.
You import a fact table named Sales as shown in the exhibit. (Click the Exhibit tab.)
The related dimension tables are imported into the model.
For each of the following statements, select Yes if the statement is true. Otherwise, select No.
NOTE: Each correct selection is worth one point.

Each employee has one manager as shown in the ParentEmployeelD column,
All reporting paths lead to the CEO at the top of the organizational hierarchy.
You need to create a calculated column that returns the count of levels from each employee to the CEO.
Which DAX expression should you use?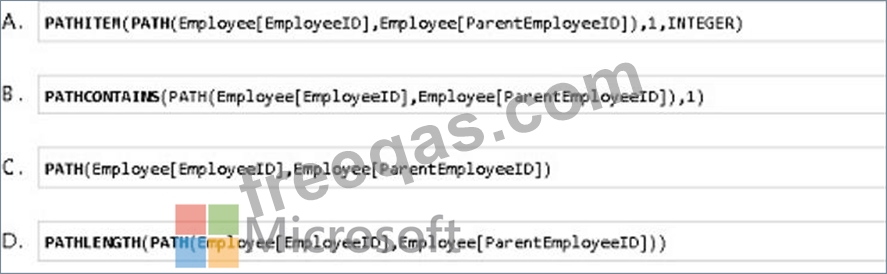
You have the Power BI data model shown in the following exhibit.
Use the drop-down menus to select the answer choice that completes each statement based on the information presented in the graphic.
NOTE: Each correct selection is worth one point.

You plan to embed multiple visualization in a public website.
Your Power BI infrastructure contains the visualizations configured as shown in the following table.
Which two visualizations can you embed into the website? Each correct answer presents a complete the solution.
NOTE: Each correct selection is worth one point.
You need to create a relationship in the dataset for RLS.
What should you do? To answer select the appropriate options in the answer area.
NOTE: Each correct selection is worth one point.
