How should you distribute the reports to the board? To answer, select the appropriate options in the answer area.
NOTE: Each correct selection is worth one point.

You have a Power BI report that contains the table visual shown in the following exhibit.


Note: This question is a part of a series of questions that present the same scenario. For your convenience, the scenario is repeated in each question. Each question presents a different goal and answer choices, but the text of the scenario is exactly the same in each question in this series.
Start of repeated scenario
You have a Microsoft SQL Server database that has the tables shown in the Database Diagram exhibit. (Click the Exhibit.)
You plan to develop a Power BI model as shown in the Power BI Model exhibit. (Click the Exhibit).
You plan to use Power BI to import data from 2013 to 2015.
Product Subcategory [Subcategory] contains NULL values.
End of repeated scenario.
You implement the Power BI model.
You add another table named Territory to the model. A sample of the data is shown in the following table.
You need to create a relationship between the Territory table and the Sales table.
Which function should you use in the query for Territory before you create the relationship?
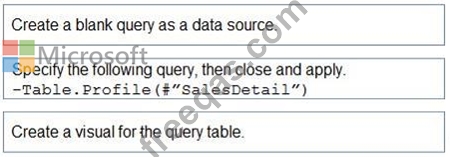
You are modeling data in table named SalesDetail by using Microsoft Power Bl.
You need to provide end users with access to the summary statistics about the SalesDetail data. The users require insights on the completeness of the data and the value distributions.
Which three actions should you perform in sequence? To answer, move the appropriate actions from the list of actions to the answer area and arrange them in the correct order.

You have a dataset that contains revenue data from the past year.
You need to use anomaly detection in Power Bl to show anomalies in the dataset.
What should you configure? To answer, select the appropriate options in the answer area.
NOTE: Each correct selection is worth one point.

