Note: This question is part of a series of questions that present the same scenario. Each question in the series contains a unique solution that might meet the stated goals. Some question sets might have more than one correct solution, while others might not have a correct solution.
After you answer a question in this section, you will NOT be able to return to it. As a result, these questions will not appear in the review screen.
From Power Query Editor, you profile the data shown in the following exhibit.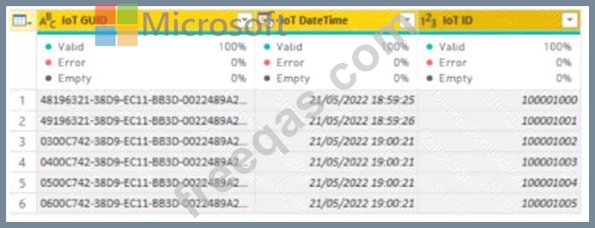
The IOT ID columns are unique to each row in query.
You need to analyze 10T events by the hour and day of the year. The solution must improve dataset performance.
Solution: You create a custom column that concatenates the 10T GUID column and the IoT ID column and then delete the IoT GUID and IoT ID columns.
Does this meet the goal?
You have a Power BI model that contains a table named Sales and a related date table. Sales contains a measure named Total Sales You need to create a measure that calculates the total sales from the equivalent month of the previous year.
How should you complete the calculation? To answer, select the appropriate options in the answer area NOTE: Each correct selection is worth one point.

You build a report to analyze customer transactions from a database that contains the tables shown in the following table.
You import the tables.
Which relationship should you use to link the tables?
You are creating a line chart in a Power Bl report as shown in the following exhibit.
Use the drop-down menus to select the answer choice that completes each statement based on the information presented in the graphic.
NOTE: Each correct selection is worth one point.

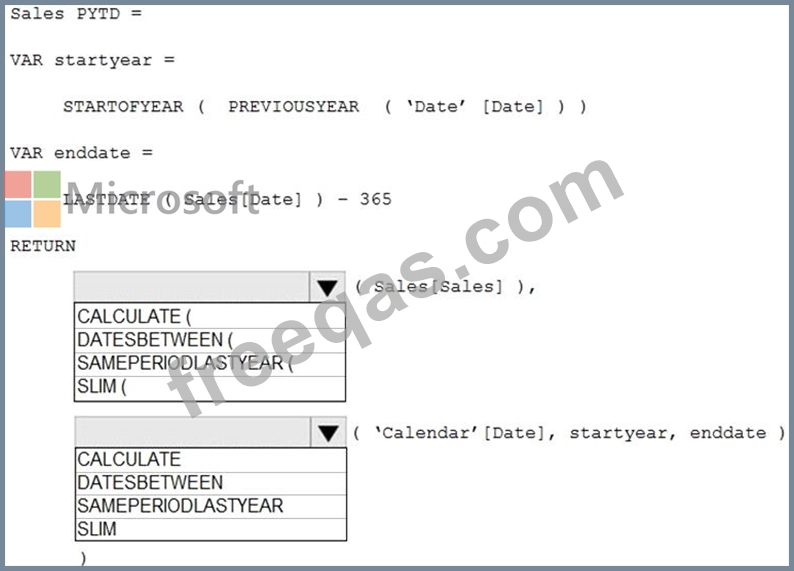
You are enhancing a Power BI model that has DAX calculations.
You need to create a measure that returns the year-to-date total sales from the same date of the previous calendar year.
Which DAX functions should you use? To answer, select the appropriate options in the answer area.
NOTE: Each correct selection is worth one point.