You have a Microsoft Power BI data model that contains three tables named Sales, Product, and Date.
The Sales table has an existing measure named [Total Sales] that sums the total sales from the Sales table.
You need to write a calculation that returns the percentage of total sales that a selected ProductCategoryName value represents. The calculation must respect any slicers on ProductCategoryName and must show the percentage of visible total sales. For example, if there are four ProductCategoryName values, and a user filters one out, a table showing ProductCategoryName and the calculation must sum up to 100 percent.
How should you complete the calculation? To answer, drag the appropriate values to the correct targets. Each value may be used once, more than once, or not at all. You may need to drag the split bar between panes or scroll to view content.
NOTE: Each correct selection is worth one point.

For the sales department at your company, you publish a Power Bl report that imports data from a Microsoft Excel We located in a Microsoft SharePoint folder The data model contains several measures You need to create a Power Bl report from the existing dat a. The solution must minimize development effort. Which type ol data source should you use?
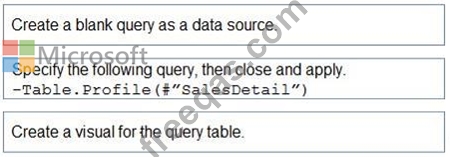
You are modeling data in table named SalesDetail by using Microsoft Power Bl.
You need to provide end users with access to the summary statistics about the SalesDetail data. The users require insights on the completeness of the data and the value distributions.
Which three actions should you perform in sequence? To answer, move the appropriate actions from the list of actions to the answer area and arrange them in the correct order.
You have two CSV files named Products and Categories.
The Products file contains the following columns:
* ProductID
* ProductName
* SupplierID
* CategoryID
The Categories file contains the following columns:
* CategoryID
* CategoryName
* CategoryDescription
From Power BI Desktop, you import the files into Power Query Editor.
You need to create a Power BI dataset that will contain a single table named Product. The Product will table includes the following columns:
* ProductID
* ProductName
* SupplierID
* CategoryID
* CategoryName
* CategoryDescription
How should you combine the queries, and what should you do on the Categories query? To answer, select the appropriate options in the answer area.
NOTE: Each correct selection is worth one point.


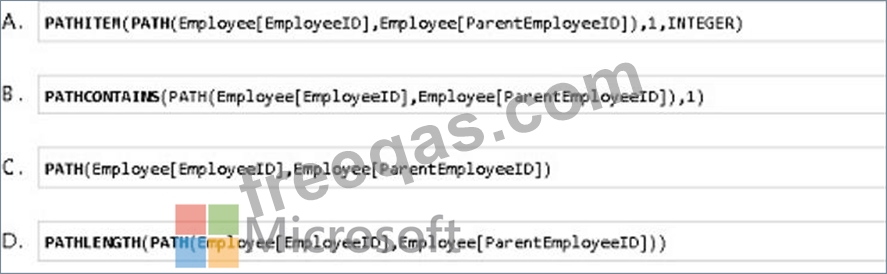
Each employee has one manager as shown in the ParentEmployeelD column,
All reporting paths lead to the CEO at the top of the organizational hierarchy.
You need to create a calculated column that returns the count of levels from each employee to the CEO.
Which DAX expression should you use?