You are creating a dashboard by using the Power Bl service.
You have an existing report page that contains three charts.
You need to add the charts to the dashboard while maintaining the interactivity between the charts.
What should you do?
You have a Power BI model that contains the following data.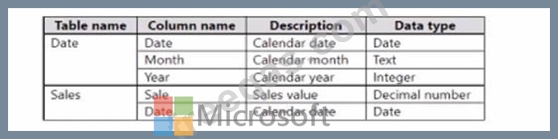
The Date table relates to the Sales table by using the Date columns.
You need to create a calculated table that v/ill contain the following:


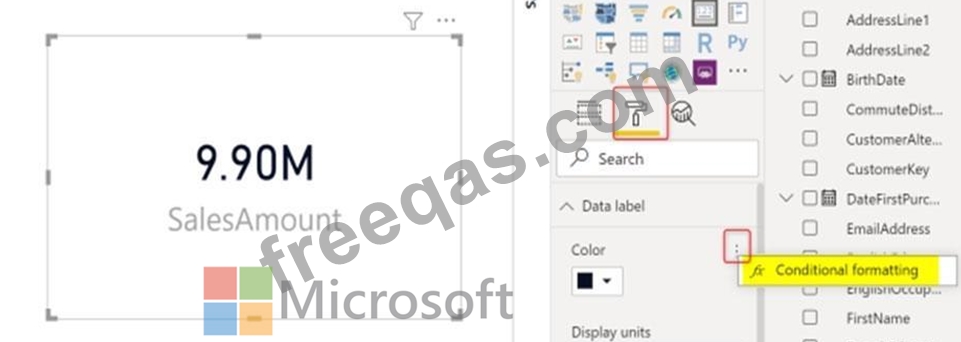
You have a report that includes a card visualization.
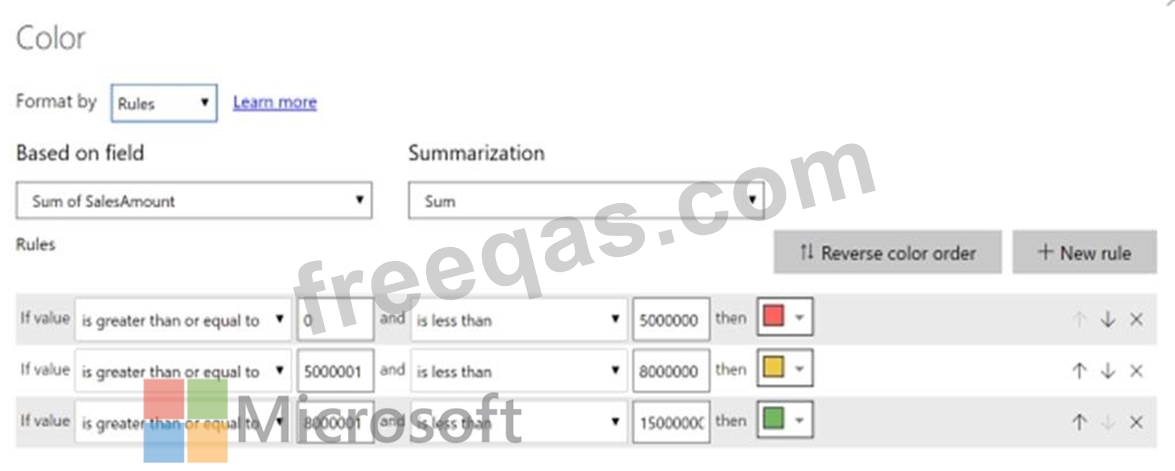
You need to apply the following conditional formatting to the card while minimizing design effort.
For values that are greater than or equal to 100, the font of the data label must be dark red.
For values that are less than 100, the font of the data label must be dark gray.
Which type of format should you use?

In Power BI Desktop, you are building a sales report that contains two tables. Both tables have row-level security (RLS) configured.
You need to create a relationship between the tables. The solution must ensure that bidirectional cross- filtering honors the RLS settings.
What should you do?

You import a Power Bl dataset that contains the following tables:
- Date
- Product
- Product Inventory
The Product inventory table contains 25 million rows. A sample of the data is shown in the following table.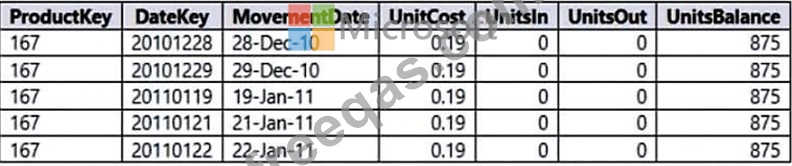
The Product Inventory table relates to the Date table by using the DateKey column. The Product inventory table relates to the Product table by using the ProductKey column.
You need to reduce the size of the data model without losing information. What should you do?