You have a Microsoft Power BI data model that contains three tables named Orders, Date, and City. There is a one-to-many relationship between Date and Orders and between City and Orders.
The model contains two row-level security (RLS) roles named Role1 and Role2. Role1 contains the following filter.
City[State Province] = "Kentucky"
Role2 contains the following filter.
Date[Calendar Year] = 2020
If a user is a member of both Role1 and Role2, what data will they see in a report that uses the model?
You create a Power BI report named RPT1 that contains sales data. The data contains 10 million rows. RPT1 contains 15 different visuals.
Users state that RPT1 is slow to load.
You need to investigate the cause of the issue.
What should you use?
You have a Microsoft Excel workbook that contains two sheets named Sheet1 and Sheet2. Sheet1 contains the following table named Table1.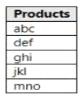
Sheet2 contains the following table named Table2.

You need to create a visualization that compares revenue and cost over time.
Which type of visualization should you use?

In Power Bi Desktop, you are creating visualizations in a report based on an imported dataset.
You need to allow Power Bi users to export the summarized data used to create the visualizations but prevent the users from exporting the underlying data.
What should you do?

