FreeQAs
 Request Exam  Contact
  • Home
  • View All Exams
  • New QA's
  • Upload
PRACTICE EXAMS:
  • Oracle
  • Fortinet
  • Juniper
  • Microsoft
  • Cisco
  • Citrix
  • CompTIA
  • VMware
  • ISC
  • SAP
  • EMC
  • PMI
  • HP
  • Salesforce
  • Other
  • Oracle
    Oracle
  • Fortinet
    Fortinet
  • Juniper
    Juniper
  • Microsoft
    Microsoft
  • Cisco
    Cisco
  • Citrix
    Citrix
  • CompTIA
    CompTIA
  • VMware
    VMware
  • ISC
    ISC
  • SAP
    SAP
  • EMC
    EMC
  • PMI
    PMI
  • HP
    HP
  • Salesforce
    Salesforce
  1. Home
  2. Microsoft Certification
  3. PL-300 Exam
  4. Microsoft.PL-300.v2026-08-10.q541 Dumps
  • ««
  • «
  • …
  • 61
  • 62
  • 63
  • 64
  • 65
  • 66
  • 67
  • 68
  • 69
  • 70
  • …
  • »
  • »»
Download Now

Question 321

You need to create a visual as shown in the following exhibit.

The indicator color for Total Sales will be based on % Growth to Last Year.
The solution must use the existing calculations only.
How should you configure the visual? To answer, select the appropriate options in the answer area.
NOTE: Each correct selection is worth one point.

Correct Answer:

Reference:
https://docs.microsoft.com/en-us/power-bi/create-reports/desktop-conditional-table-formatting
insert code

Question 322

You create a dashboard by using the Microsoft Power Bl Service. The dashboard contains a card visual that shows total sales from the current year. You grant users access to the dashboard by using the viewer role on the workspace. A user wants to receive daily notifications of the number shown on the card visual. You need to automate the notifications. What should you do?

Correct Answer: C
You can subscribe yourself and your colleagues to the report pages, dashboards, and paginated reports that matter most to you. Power BI e-mail subscriptions allow you to:
Decide how often you want to receive the emails: daily, weekly, hourly, monthly, or once a day after the initial data refresh.
Choose the time you want to receive the email, if you choose daily, weekly, hourly, or monthly.
Note: Email subscriptions don't support most custom visuals. The one exception is those custom visuals that have been certified.
Email subscriptions don't support R-powered custom visuals at this time.
Incorrect Answers:
A: Set data alerts to notify you when data in your dashboards changes beyond limits you set.
Reference:
https://docs.microsoft.com/en-us/power-bi/collaborate-share/service-report-subscribe
https://docs.microsoft.com/en-us/power-bi/create-reports/service-set-data-alerts
insert code

Question 323

You plan to develop a Power BI report that has a bar chart to display the number of customers by location.
You have a table named Customer that has the following columns:
* Customer ID
* CustomerName
* Address
* City
* ProvState
* Country
You need to allow users to drill down by location. The report will display the number of each customer by Country, and drill down to ProvState, and then to City. How should you configure the drill down in the bar chart?

Correct Answer: C
Explanation
References:
https://docs.microsoft.com/en-us/power-bi/guided-learning/visualizations#step-18
https://docs.microsoft.com/en-us/power-bi/power-bi-visualization-drill-down
insert code

Question 324

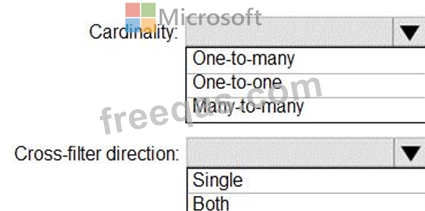
You are creating a Microsoft Power BI data model that has the tables shown in the following table.

The Products table is related to the ProductCategory table through the ProductCategoryID column.
You need to ensure that you can analyze sales by product category.
How should you configure the relationships from Products to ProductCategory? To answer, select the appropriate options in the answer area.
NOTE: Each correct selection is worth one point.
Correct Answer:

Reference:
https://docs.microsoft.com/en-us/power-bi/transform-model/desktop-relationships-understand
insert code

Question 325

You have an API that returns more than 100 columns. The following is a sample of column names.
* client_notified_timestamp
* client_notified_source
* client_notified_sourceid
* client_notified_value
* client_responded_timestamp
* client_responded_source
* client_responded_sourceid
* client_responded_value
You plan to include only a subset of the returned columns.
You need to remove any columns that have a suffix of sourceid.
How should you complete the Power Query M code? To answer, select the appropriate options in the answer area.
NOTE: Each correct selection is worth one point.

Correct Answer:

Explanation:
Box 1: Table.RemoveColumns
When you do "Remove Columns" Power Query uses the Table.RemoveColumns function Box 2: List.Select Get a list of columns.
Box 3: Text.EndsWith
insert code
  • ««
  • «
  • …
  • 61
  • 62
  • 63
  • 64
  • 65
  • 66
  • 67
  • 68
  • 69
  • 70
  • …
  • »
  • »»
[×]

Download PDF File

Enter your email address to download Microsoft.PL-300.v2026-08-10.q541 Dumps

Email:

FreeQAs

Our website provides the Largest and the most Latest vendors Certification Exam materials around the world.

Using dumps we provide to Pass the Exam, we has the Valid Dumps with passing guranteed just which you need.

  • DMCA
  • About
  • Contact Us
  • Privacy Policy
  • Terms & Conditions
©2026 FreeQAs

www.freeqas.com materials do not contain actual questions and answers from Cisco's certification exams.
