You have a dataset named Pens that contains the following columns:
Unit Price
Quantity Ordered
You need to create a visualization that shows the relationship between Unit Price and Quantity Ordered. The solution must highlight orders that have a similar unit price and ordered quantity.
Which type of visualization and which feature should you use? To answer, select the appropriate options in the answer area.
NOTE: Each correct selection is worth one point.

The data model must support the following analysis:
* Total sales by product by month in which the order was placed
* Quantities sold by product by day on which the order was placed
* Number Of sales transactions by quarter in Which the order was placed For each Of the following statements, select Yes if the statement is true. Otherwise, select NO.


You are creating a Microsoft Power BI data model that has the tables shown in the following table.
The Products table is related to the ProductCategory table through the ProductCategoryID column.
You need to ensure that you can analyze sales by product category.
How should you configure the relationships from Products to ProductCategory? To answer, select the appropriate options in the answer area.
NOTE: Each correct selection is worth one point.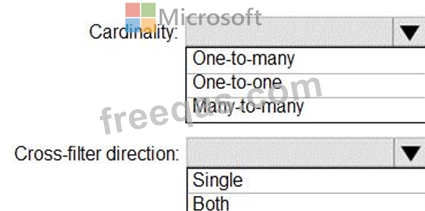

You have a table that contains the following three columns:
* City
* Total Sales
* Occupation
You need to create a key influencers visualization as shown in the exhibit. (Click the Exhibit tab.)
How should you configure the visualization? To answer, select the appropriate options in the answer area.
NOTE: Each correct selection is worth one point.


Vou plan to create a Power B1 report that will be connected to multiple data sources. One of the data sources contains law records. You need to ensure that other queries cannot access the tax record Information. To what should you set Privacy Level for the data source?

