You need to create a chart of type Indicator: Numeric Point that displays the following output: count of employees with the gender male divided by the count of employee with the gender female.
The chart can then be filtered for different departments. What calculation is required to create the metric?
You have created a custom MDF object to track company car information. You need to be able to create story reports on the data of the custom MDF object. What must you do to enable a custom MDF object to be listed in the Available Data section of Query Designer?
You are creating a query that lists employee information such as name, address, and dependent information. The query uses Personal Information as the driving table and joins the Dependents and Address tables. You notice many employees are missing from the result set. What are the reasons?
An administrator creates a new MDF object for storing attachments related to an employee's dependents. After uploading some test data, the administrator states they are unable to report on the new data with Advanced Reporting tool in a canvas report. The administrator is working for a client that has already had their system transitioned to Workforce Analytics on SAP HANA. How can the administrator quickly make the data available for reporting?
The drill-down list of a tile contains more entries than the values displayed in a chart (see attached image).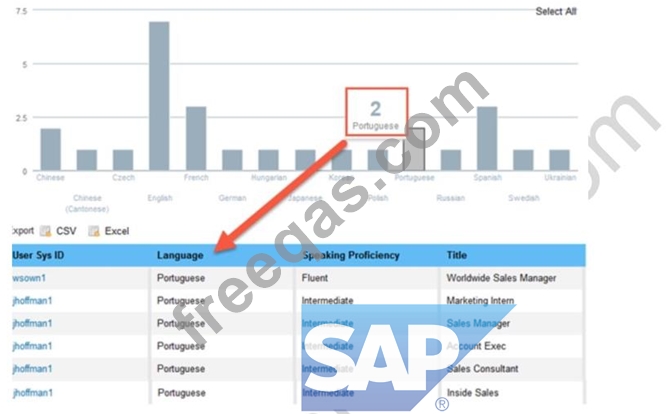
How do you make the outputs match?
