FreeQAs
 Request Exam  Contact
  • Home
  • View All Exams
  • New QA's
  • Upload
PRACTICE EXAMS:
  • Oracle
  • Fortinet
  • Juniper
  • Microsoft
  • Cisco
  • Citrix
  • CompTIA
  • VMware
  • ISC
  • SAP
  • EMC
  • PMI
  • HP
  • Salesforce
  • Other
  • Oracle
    Oracle
  • Fortinet
    Fortinet
  • Juniper
    Juniper
  • Microsoft
    Microsoft
  • Cisco
    Cisco
  • Citrix
    Citrix
  • CompTIA
    CompTIA
  • VMware
    VMware
  • ISC
    ISC
  • SAP
    SAP
  • EMC
    EMC
  • PMI
    PMI
  • HP
    HP
  • Salesforce
    Salesforce
  1. Home
  2. Tableau Certification
  3. Desktop-Specialist Exam
  4. Tableau.Desktop-Specialist.v2022-08-21.q54 Dumps
  • «
  • 1
  • 2
  • 3
  • 4
  • 5
  • 6
  • 7
  • 8
  • 9
  • 10
  • …
  • »
  • »»
Download Now

Question 11

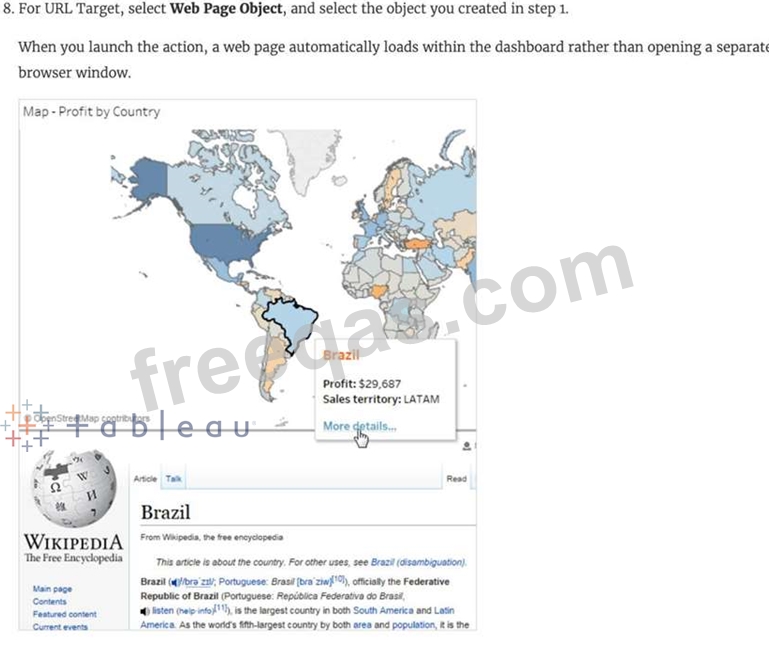
Is it possible to deploy a URL action on a dashboard object to open a Web Page within a dashboard rather than opening the system's web browser?

Correct Answer: C
Explanation
To interactively display information from the web INSIDE a dashboard, you can use a URL action with a web page object.
For example, you might have a dashboard that shows profits by country. In addition to showing the profit data in your dashboard, you also want to display supplemental information about the countries from a web site.


insert code

Question 12

Skipped Join the Geo Data and Time Series Table on the Item Number ID column, and display the Store count for every State on a Map. What was the Store count in 2017 for Texas (TX)?
Join the Geo Data and Time Series Table on the Item Number ID column, and display the Store count for every State on a Map. What was the Store count in 2017 for Texas (TX)?

Correct Answer: C
Explanation
Since you need BOTH State and the YEAR, we need to use an Inner Join.
Follow the steps below:
insert code

Question 13

Which of the following is a benefit of using a Tableau Data Source (.tds)?

Correct Answer: B
Explanation
The following are the official definitions from the Tableau documentation for the various file types:
1) .tds (Tableau Data Source) - To not contain the actual data but rather the information necessary to connect to the actual data as well as any modifications you've made on top of the actual data such as changing default properties, creating calculated fields etc. (CORRECT ANSWER)
2) .twbx ( Tableau packaged workbook) - To create a single zip file that contains a workbook along with any supporting local file data and background images. This is great for sharing your work with others who don't have access to the original data.
3) Extract (.hyper or .tde) - To create a local copy of a subset or entire data set that you can use to share data with others, when you need to work offline, and improve performance.
3) (.twb) Workbooks - To hold one or more worksheets, plus zero or more dashboards and stories.
insert code

Question 14

Using the atheletes table:
i) Create a sheet with a crosstab showing the Average weight for each sport (Sheet 1) ii) Create a sheet with a Map showing the Total number of gold medals per Country. Use size as a Mark.
(Sheet 2)
Now, Create a Dashboard containing both these sheets, and Use Sheet 2 as a Filter for Sheet 1. What was the average weight for Badminton in Russia?
(Ignore any nulls / unknowns)

Correct Answer: A
Explanation
Pretty common question on the Tableau Desktop Specialist exam.
1) First, lets create Sheet 1. For this, drag sport to the Row shelf, and Weight to the Text mark in the Marks shelf. Change its aggregation to Average:

2) Now, for sheet 2 - Drag nationality to the view, and gold to the size mark in the Marks shelf.
NOTE: Depending on your version of Tableau , you may need to assign a Geographical role to the nationality column first as follows:


3) Now, let's create a dashboard, and use both these sheets in it:

4) Now, for the most Important step, use SHEET 2 AS A FILTER FOR SHEET 1 as follows:

Now simply click on Russia in Sheet 2, and Sheet 1 will automatically update as follows:
insert code

Question 15

For Bullet Graphs we need at least ____________ measures

Correct Answer: C
Explanation
A bullet graph is a variation of a bar graph developed to replace dashboard gauges and meters. A bullet graph is useful for comparing the performance of a primary measure to one or more other measures.
Therefore, we need at least 2 measures for creating bullet graphs.
insert code
  • «
  • 1
  • 2
  • 3
  • 4
  • 5
  • 6
  • 7
  • 8
  • 9
  • 10
  • …
  • »
  • »»
[×]

Download PDF File

Enter your email address to download Tableau.Desktop-Specialist.v2022-08-21.q54 Dumps

Email:

FreeQAs

Our website provides the Largest and the most Latest vendors Certification Exam materials around the world.

Using dumps we provide to Pass the Exam, we has the Valid Dumps with passing guranteed just which you need.

  • DMCA
  • About
  • Contact Us
  • Privacy Policy
  • Terms & Conditions
©2026 FreeQAs

www.freeqas.com materials do not contain actual questions and answers from Cisco's certification exams.