FreeQAs
 Request Exam  Contact
  • Home
  • View All Exams
  • New QA's
  • Upload
PRACTICE EXAMS:
  • Oracle
  • Fortinet
  • Juniper
  • Microsoft
  • Cisco
  • Citrix
  • CompTIA
  • VMware
  • ISC
  • SAP
  • EMC
  • PMI
  • HP
  • Salesforce
  • Other
  • Oracle
    Oracle
  • Fortinet
    Fortinet
  • Juniper
    Juniper
  • Microsoft
    Microsoft
  • Cisco
    Cisco
  • Citrix
    Citrix
  • CompTIA
    CompTIA
  • VMware
    VMware
  • ISC
    ISC
  • SAP
    SAP
  • EMC
    EMC
  • PMI
    PMI
  • HP
    HP
  • Salesforce
    Salesforce
  1. Home
  2. Tableau Certification
  3. TCC-C01 Exam
  4. Tableau.TCC-C01.v2025-01-06.q20 Dumps
  • «
  • 1
  • 2
  • 3
  • 4
  • 5
Download Now

Question 16

A consultant is designing a dashboard that will be consumed on desktops, tablets, and phones. The consultant needs to implement a dashboard design that provides the best user experience across all the platforms.
Which approach should the consultant take to achieve these results?

Correct Answer: A
For a consultant designing a dashboard to be consumed across multiple device types, the best approach is:
* Multi-device Layout: Tableau provides the capability to design device-specific layouts within a single dashboard. This feature allows the dashboard to adapt its layout to best fit the screen size and orientation of desktops, tablets, and phones.
* Fixed Size Layouts: By fixing the size of each layout, the consultant can ensure that the dashboard appears consistent and maintains the intended design elements and user experience across devices. Fixed sizes prevent components from resizing in ways that could disrupt the dashboard's readability or functionality.
* Implementation: In Tableau, you can create these layouts by selecting 'Device Preview' and adding custom layouts for each device type. Here, you define the dimensions and the positioning of sheets and controls tailored to each device's typical viewing mode.
ReferencesThis approach leverages Tableau's device designer capabilities, which are specifically designed to optimize dashboards for multiple viewing environments, ensuring a seamless user experience regardless of the device used. This functionality is well documented in Tableau's official guides on creating and managing device-specific dashboards.
insert code

Question 17

A client notices that while creating calculated fields, occasionally the new fields are created as strings, integers, or Booleans. The client asks a consultant if there is a performance difference among these three data types.
What should the consultant tell the customer?

Correct Answer: B
In Tableau, the performance of calculated fields can vary based on the data type used. Calculations involving integers and Booleans are generally faster than those involving strings. This is because numerical operations are typically more efficient for a computer to process than string operations, which can be more complex and time-consuming. Therefore, when performance is a consideration, it is advisable to use integers or Booleans over strings whenever possible.
References:The performance hierarchy of data types in Tableau calculations is documented in resources that discuss best practices for optimizing Tableau performance1.
insert code

Question 18

From the desktop, open the CCworkbook. Use the US PopulationEstimates data source.
You need to shape the data in USPopulation Estimates by using TableauDesktop. The data must be formatted asshown in the following table.
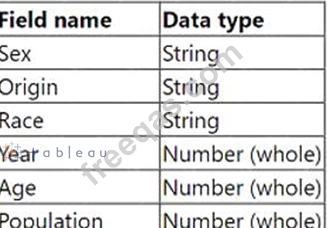
Open the Population worksheet. Enterthe total number of records contained inthe data set into the Total Recordsparameter.
From the File menu in Tableau Desktop,click Save.

Correct Answer:
See the complete Steps below in Explanation:
Explanation:
To shape the data in the "US Population Estimates" data source and enter the total number of records into the
"Total Records" parameter in Tableau Desktop, follow these steps:
* Open the CC Workbook and Access the Worksheet:
* From the desktop, double-click on the CC workbook to open it in Tableau Desktop.
* Navigate to the Population worksheet by selecting its tab at the bottom of the window.
* Format and Shape the Data:
* Ensure the data types match those specified in the requirements: Sex, Origin, Race as strings; Year, Age, Population as whole numbers.
* To verify or change the data type, click on the dropdown arrow next to each field name in the Data pane and select "Change Data Type" if necessary.
* Calculate Total Number of Records:
* Create a new calculated field named "Total Records". To do this, right-click in the Data pane and select "Create Calculated Field".
* Enter the formulaCOUNT([Record ID])orSUM([Number of Records])depending on how the data source identifies each row uniquely.
* Drag this new calculated field onto the worksheet to display the total number of records.
* Enter the Value into the Total Records Parameter:
* Locate the "Total Records" parameter in the Data pane. Right-click on the parameter and select
"Edit".
* Manually enter the number displayed from the calculated field into the parameter, ensuring accuracy to meet the data shaping requirement.
* Save Your Changes:
* From the File menu, click 'Save' to ensure all your changes are stored.
References:
* Tableau Desktop Guide: Provides detailed instructions on managing data types, creating calculated fields, and updating parameters.
* Tableau Data Shaping Techniques: Outlines effective methods for manipulating and structuring data for analysis.
This process will ensure the data in the "US Population Estimates" is accurately shaped according to the specified format and that the total number of records is correctly calculated and entered into the designated parameter. This thorough approach ensures data integrity and accuracy in reporting.
insert code

Question 19

A consultant wants to improve the performance of reports by moving calculations to the data layer and materializing them in the extract.
Which calculation should the consultant use?

Correct Answer: C
To improve performance by moving calculations to the data layer and materializing them in the extract, the consultant should choose calculations that benefit from pre-computation and significantly reduce the load during query time:
* Aggregation-Level Calculation: The formula SUM([Profit])/SUM([Sales]) calculates a ratio at an aggregate level, which is ideal for pre-computation. Materializing this calculation in the extract means that the complex division operation is done once and stored, rather than being recalculated every time the report is accessed.
* Performance Improvement: By pre-computing this aggregate ratio, Tableau can utilize the pre-calculated fields directly in visualizations, which speeds up report loading and interaction times as the heavy lifting of data processing is done during the data preparation stage.
References:
* Materialization in Extracts: This concept involves pre-calculating and storing complex aggregations or calculations within the Tableau data extract itself, improving performance by reducing the computational load during visualization rendering.
insert code

Question 20

A multi-national company wants to have a Tableau dashboard that will provide country-level information for both its forecast summaries and year-on-year metrics. The company wants to toggle between these two views while leaving main key performance indicators (KPIs) visible on the main dashboard.
Which method is the most efficient in achieving the company's requirements?


Correct Answer: D
The most efficient method for toggling between two views (forecast summaries and year-on-year metrics) while keeping main KPIs visible involves using a parameter and calculated fields for controlling visibility:
* Create a Boolean Parameter: This parameter will have two aliases representing the two views ("Forecast View" and "Year-on-Year View"). This allows the user to select which view they wish to see directly from the dashboard.
* Calculated Field: Create a calculated field that always returnsTrue. This field acts as a constant placeholder to enable the visibility control tied to the parameter.
* Dashboard Setup: Place both the forecast summary and the year-on-year metrics sheets on the dashboard. Set the year-on-year metrics sheet as a floating object over the forecast summary.
* Visibility Control: Use the "Control visibility using value" option in the Layout tab for the floating year-on-year metrics view. Tie this setting to the Boolean parameter so that changing the parameter will show or hide this view without affecting the main KPIs displayed on the dashboard.
* Interactivity: Implement a "Change Parameter" dashboard action where selecting different options in the dashboard (e.g., clicking on certain parts) triggers the parameter to change, thus toggling the visible view.
ReferencesThis method leverages Tableau's dashboard interactivity features including parameters, calculated fields, and visibility settings, as recommended in Tableau's user guide on dynamic dashboard design.
insert code
  • «
  • 1
  • 2
  • 3
  • 4
  • 5
[×]

Download PDF File

Enter your email address to download Tableau.TCC-C01.v2025-01-06.q20 Dumps

Email:

FreeQAs

Our website provides the Largest and the most Latest vendors Certification Exam materials around the world.

Using dumps we provide to Pass the Exam, we has the Valid Dumps with passing guranteed just which you need.

  • DMCA
  • About
  • Contact Us
  • Privacy Policy
  • Terms & Conditions
©2026 FreeQAs

www.freeqas.com materials do not contain actual questions and answers from Cisco's certification exams.