FreeQAs
 Request Exam  Contact
  • Home
  • View All Exams
  • New QA's
  • Upload
PRACTICE EXAMS:
  • Oracle
  • Fortinet
  • Juniper
  • Microsoft
  • Cisco
  • Citrix
  • CompTIA
  • VMware
  • ISC
  • SAP
  • EMC
  • PMI
  • HP
  • Salesforce
  • Other
  • Oracle
    Oracle
  • Fortinet
    Fortinet
  • Juniper
    Juniper
  • Microsoft
    Microsoft
  • Cisco
    Cisco
  • Citrix
    Citrix
  • CompTIA
    CompTIA
  • VMware
    VMware
  • ISC
    ISC
  • SAP
    SAP
  • EMC
    EMC
  • PMI
    PMI
  • HP
    HP
  • Salesforce
    Salesforce
  1. Home
  2. Microsoft Certification
  3. DP-100 Exam
  4. Microsoft.DP-100.v2022-03-09.q103 Dumps
  • ««
  • «
  • …
  • 8
  • 9
  • 10
  • 11
  • 12
  • 13
  • 14
  • 15
  • 16
  • 17
  • …
  • »
  • »»
Download Now

Question 56

You are performing feature engineering on a dataset.
You must add a feature named CityName and populate the column value with the text London.
You need to add the new feature to the dataset.
Which Azure Machine Learning Studio module should you use?

Correct Answer: B
Typical metadata changes might include marking columns as features.
Reference:
https://docs.microsoft.com/en-us/azure/machine-learning/studio-module-reference/edit-metadata Develop models Testlet 1 Case study Overview You are a data scientist in a company that provides data science for professional sporting events. Models will use global and local market data to meet the following business goals:
* Understand sentiment of mobile device users at sporting events based on audio from crowd reactions.
* Assess a user's tendency to respond to an advertisement.
* Customize styles of ads served on mobile devices.
* Use video to detect penalty events
Current environment
* Media used for penalty event detection will be provided by consumer devices. Media may include images and videos captured during the sporting event and shared using social media. The images and videos will have varying sizes and formats.
* The data available for model building comprises of seven years of sporting event media. The sporting event media includes; recorded video transcripts or radio commentary, and logs from related social media feeds captured during the sporting events.
* Crowd sentiment will include audio recordings submitted by event attendees in both mono and stereo formats.
Penalty detection and sentiment
* Data scientists must build an intelligent solution by using multiple machine learning models for penalty event detection.
* Data scientists must build notebooks in a local environment using automatic feature engineering and model building in machine learning pipelines.
* Notebooks must be deployed to retrain by using Spark instances with dynamic worker allocation.
* Notebooks must execute with the same code on new Spark instances to recode only the source of the data.
* Global penalty detection models must be trained by using dynamic runtime graph computation during training.
* Local penalty detection models must be written by using BrainScript.
* Experiments for local crowd sentiment models must combine local penalty detection data.
* Crowd sentiment models must identify known sounds such as cheers and known catch phrases. Individual crowd sentiment models will detect similar sounds.
* All shared features for local models are continuous variables.
* Shared features must use double precision. Subsequent layers must have aggregate running mean and standard deviation metrics available.
Advertisements
During the initial weeks in production, the following was observed:
* Ad response rated declined.
* Drops were not consistent across ad styles.
* The distribution of features across training and production data are not consistent Analysis shows that, of the 100 numeric features on user location and behavior, the 47 features that come from location sources are being used as raw features. A suggested experiment to remedy the bias and variance issue is to engineer 10 linearly uncorrelated features.
* Initial data discovery shows a wide range of densities of target states in training data used for crowd sentiment models.
* All penalty detection models show inference phases using a Stochastic Gradient Descent (SGD) are running too slow.
* Audio samples show that the length of a catch phrase varies between 25%-47% depending on region
* The performance of the global penalty detection models shows lower variance but higher bias when comparing training and validation sets. Before implementing any feature changes, you must confirm the bias and variance using all training and validation cases.
* Ad response models must be trained at the beginning of each event and applied during the sporting event.
* Market segmentation models must optimize for similar ad response history.
* Sampling must guarantee mutual and collective exclusively between local and global segmentation models that share the same features.
* Local market segmentation models will be applied before determining a user's propensity to respond to an advertisement.
* Ad response models must support non-linear boundaries of features.
* The ad propensity model uses a cut threshold is 0.45 and retrains occur if weighted Kappa deviated from
0.1 +/- 5%.
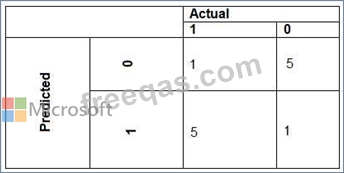
* The ad propensity model uses cost factors shown in the following diagram:

* The ad propensity model uses proposed cost factors shown in the following diagram:

* Performance curves of current and proposed cost factor scenarios are shown in the following diagram:
insert code

Question 57

You create an experiment in Azure Machine Learning Studio. You add a training dataset that contains 10,000 rows. The first 9,000 rows represent class 0 (90 percent).
The remaining 1,000 rows represent class 1 (10 percent).
The training set is imbalances between two classes. You must increase the number of training examples for class 1 to 4,000 by using 5 data rows. You add the Synthetic Minority Oversampling Technique (SMOTE) module to the experiment.
You need to configure the module.
Which values should you use? To answer, select the appropriate options in the dialog box in the answer area.
NOTE: Each correct selection is worth one point.

Correct Answer:

Explanation:
Box 1: 300
You type 300 (%), the module triples the percentage of minority cases (3000) compared to the original dataset (1000).
Box 2: 5
We should use 5 data rows.
Use the Number of nearest neighbors option to determine the size of the feature space that the SMOTE algorithm uses when in building new cases. A nearest neighbor is a row of data (a case) that is very similar to some target case. The distance between any two cases is measured by combining the weighted vectors of all features.
By increasing the number of nearest neighbors, you get features from more cases.
By keeping the number of nearest neighbors low, you use features that are more like those in the original sample.
References:
https://docs.microsoft.com/en-us/azure/machine-learning/studio-module-reference/smote
insert code

Question 58

You are creating an experiment by using Azure Machine Learning Studio.
You must divide the data into four subsets for evaluation. There is a high degree of missing values in the data.
You must prepare the data for analysis.
You need to select appropriate methods for producing the experiment.
Which three modules should you run in sequence? To answer, move the appropriate actions from the list of actions to the answer area and arrange them in the correct order.
NOTE: More than one order of answer choices is correct. You will receive credit for any of the correct orders you select.

Correct Answer:

Explanation

The Clean Missing Data module in Azure Machine Learning Studio, to remove, replace, or infer missing values.
insert code

Question 59

You have a comma-separated values (CSV) file containing data from which you want to train a classification model.
You are using the Automated Machine Learning interface in Azure Machine Learning studio to train the classification model. You set the task type to Classification.
You need to ensure that the Automated Machine Learning process evaluates only linear models.
What should you do?

Correct Answer: C
Automatic featurization can fit non-linear models.
Reference:
https://econml.azurewebsites.net/spec/estimation/dml.html
https://docs.microsoft.com/en-us/azure/machine-learning/how-to-use-automated-ml-for-ml-models
insert code

Question 60

Note: This question is part of a series of questions that present the same scenario. Each question in the series contains a unique solution that might meet the stated goals. Some question sets might have more than one correct solution, while others might not have a correct solution.
After you answer a question in this section, you will NOT be able to return to it. As a result, these questions will not appear in the review screen.
You are creating a model to predict the price of a student's artwork depending on the following variables: the student's length of education, degree type, and art form.
You start by creating a linear regression model.
You need to evaluate the linear regression model.
Solution: Use the following metrics: Mean Absolute Error, Root Mean Absolute Error, Relative Absolute Error, Relative Squared Error, and the Coefficient of Determination.
Does the solution meet the goal?


Correct Answer: A
Explanation
The following metrics are reported for evaluating regression models. When you compare models, they are ranked by the metric you select for evaluation.
Mean absolute error (MAE) measures how close the predictions are to the actual outcomes; thus, a lower score is better.
Root mean squared error (RMSE) creates a single value that summarizes the error in the model. By squaring the difference, the metric disregards the difference between over-prediction and under-prediction.
Relative absolute error (RAE) is the relative absolute difference between expected and actual values; relative because the mean difference is divided by the arithmetic mean.
Relative squared error (RSE) similarly normalizes the total squared error of the predicted values by dividing by the total squared error of the actual values.
Mean Zero One Error (MZOE) indicates whether the prediction was correct or not. In other words:
ZeroOneLoss(x,y) = 1 when x!=y; otherwise 0.
Coefficient of determination, often referred to as R2, represents the predictive power of the model as a value between 0 and 1. Zero means the model is random (explains nothing); 1 means there is a perfect fit. However, caution should be used in interpreting R2 values, as low values can be entirely normal and high values can be suspect.
AUC.
References:
https://docs.microsoft.com/en-us/azure/machine-learning/studio-module-reference/evaluate-model
insert code
  • ««
  • «
  • …
  • 8
  • 9
  • 10
  • 11
  • 12
  • 13
  • 14
  • 15
  • 16
  • 17
  • …
  • »
  • »»
[×]

Download PDF File

Enter your email address to download Microsoft.DP-100.v2022-03-09.q103 Dumps

Email:

FreeQAs

Our website provides the Largest and the most Latest vendors Certification Exam materials around the world.

Using dumps we provide to Pass the Exam, we has the Valid Dumps with passing guranteed just which you need.

  • DMCA
  • About
  • Contact Us
  • Privacy Policy
  • Terms & Conditions
©2026 FreeQAs

www.freeqas.com materials do not contain actual questions and answers from Cisco's certification exams.