You have a Power BI model that has the following tables:
Product (Product_id, Product_Name)
Sales (Order_id, Order_Date, Product_id, Salesperson_id, Sales_Amount)
Salesperson (Salesperson_id, Salesperson_name, address)
You plan to create the following measure.
Measure1 = DISTINCTCOUNT(Sales[ProductID])
You need to create the following relationships:
Sales to Product
Sales to Salesperson
The solution must ensure that you can use Measure1 to display the count of products sold by each salesperson.
How should you configure the relationships? To answer, select the appropriate options in the answer area.
NOTE: Each correct selection is worth one point.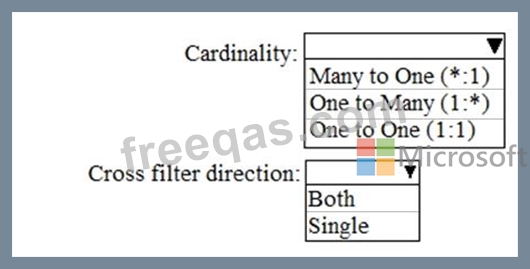

You are building a Power B1 report to analyze customer segments.
You need to identify customer segments dynamically based on the Bounce Rate across dimensions such as source, geography, and demographics. The solution must minimize analysis effort.
Which type of visualization should you use?
You have the data lineage shown in the following exhibit.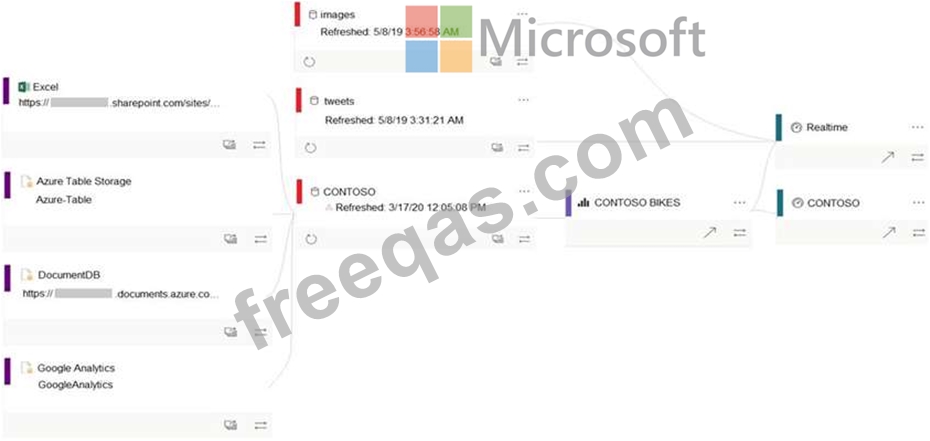
Use the drop-down menus to select the answer choice that completes each statement based on the information presented in the graphic.
NOTE: Each correct selection is worth one point.

Note: This question is part of a series of questions that present the same scenario. Each question in the series contains a unique solution that might meet the stated goals. Some question sets might have more than one correct solution, while others might not have a correct solution.
After you answer a question in this section, you will NOT be able to return to it. As a result, these questions will not appear in the review screen.
You have a Power BI model that contains two tables named Sales and Date. Sales contains four columns named TotalCost, DueDate, ShipDate, and OrderDate. Date contains one column named Date.
The tables have the following relationships:
Sales[DueDate] and Date[Date]
Sales[ShipDate] and Date[Date]
Sales[OrderDate] and Date[Date]
The active relationship is on Sales[DueDate].
You need to create measures to count the number of orders by [ShipDate] and the orders by [OrderDate]. You must meet the goal without duplicating data or loading additional data.
Solution: You create measures that use the CALCULATE, COUNT, and USERELATIONSHIP DAX functions.
Does this meet the goal?
You use an R visual to produce a map of 500,000 customers. You include the values of CustomerID, Latitude, and Longitude in the fields sent to the visual. Each customer ID is unique.
In powerbi.com, when users load the visual, they only see some of the customers.
What is the cause of the issue?
