You have a collection of reports for the HR department of your company.
You need to create a visualization for the HR department that shows a historic employee counts and predicts trends during the next six months.
Which type of visualization should you use?
You build a report to help the sales team understand its performance and the drivers of sales. The team needs to have a single visualization to identify which factors affect success .
Which type of visualization should you use?
HOTSPOT
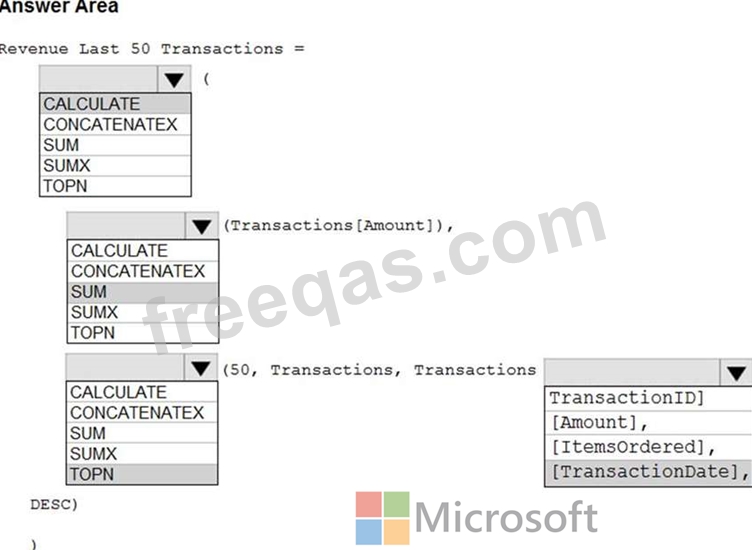
Your company has affiliates who help the company acquire customers.
You build a report for the affiliate managers at the company to assist them in understanding affiliate performance.
The managers request a visual showing the total sales value of the latest 50 transactions for each affiliate. You have a data model that contains the following tables.
You need to develop a measure to support the visual.
How should you complete the DAX expression? To answer, select the appropriate options in the answer area. NOTE: Each correct selection is worth one point.
In Power Bi Desktop, you are creating visualizations in a report based on an imported dataset You need to allow Power Bi users to export the summarized data used to create the visualizations but prevent the users from exporting the underlying data What should you do?
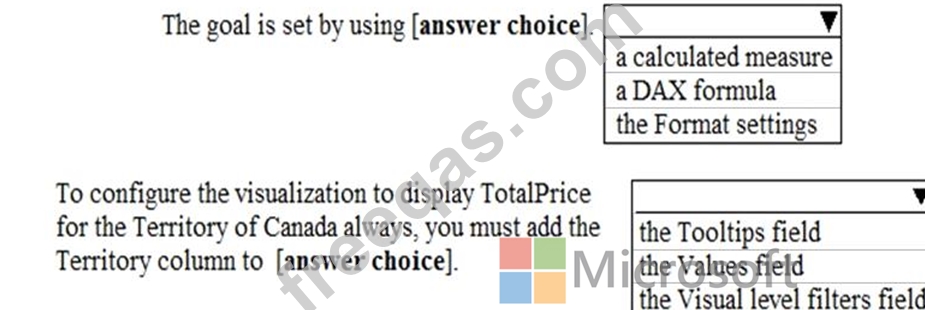
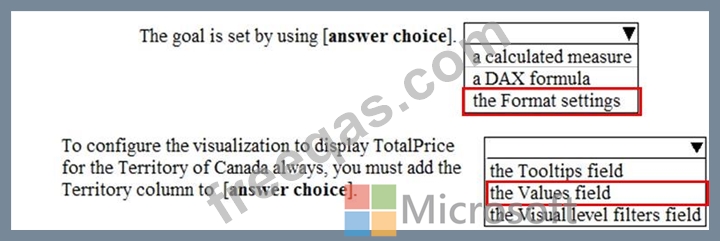
You have a report in Power BI Desktop as shown in the following exhibit.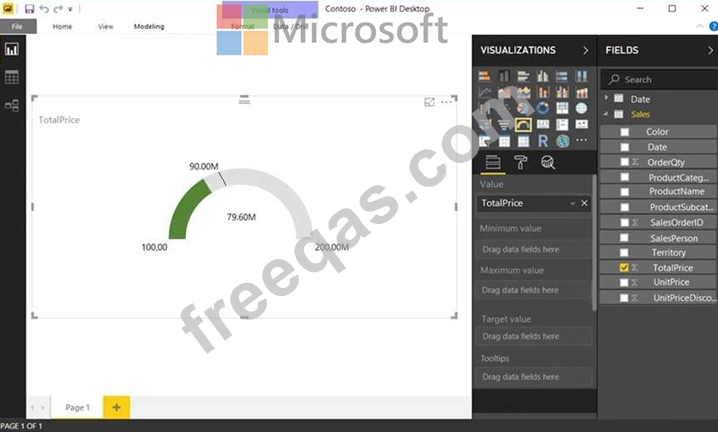
Use the drop-down menus to select the answer choice that completes each statement based on the information presented in the graphic.
Note: Each correct selection is worth one point.