You maintain a Power Bl workspace that contains a supplier quality dashboard. The dashboard contains 10 card visuals, two map visuals and five bar chart visuals.
The dashboard mobile layout is shown in the exhibit. (Click the Exhibit tab.) You need to modify the dashboard mobile layout to meet the following requirements:
* Only show single-value visuals.
* Minimize scrolling.
What should you do?
You have a Power Bl report that contains five pages.
Pages 1 to 4 are visible and page 5 is hidden.
You need to create a solution that will enable users to quickly navigate from the first page to all the other visible pages. The solution must minimize development and maintenance effort as pages are added to the report.
What should you do first?
What should you create to meet the reporting requirements of the sales department?
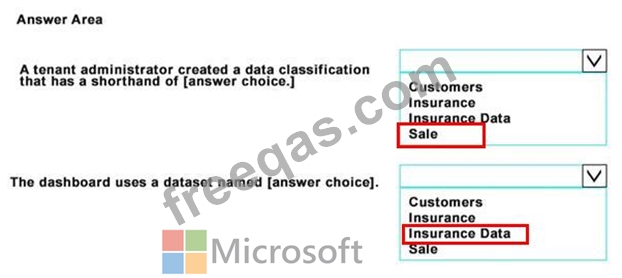
You open powerbi.com as shown in the following exhibit.
Use the drop-down menus to select the answer choice that completes each statement based on the information presented in the graphic.
NOTE: Each correct selection is worth one point.
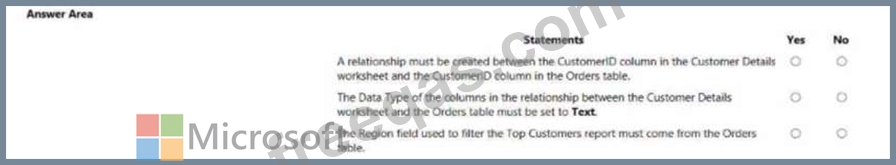
You need to design the data model and the relationships for the Customer Details worksheet and the Orders table by using Power BI. The solution must meet the report requirements.
For each of the following statement, select Yes if the statement is true, Otherwise, select No.
NOTE: Each correct selection is worth one point.