You need to create a Power BI theme that will be used in multiple reports. The theme will include corporate branding for font size, color, and bar chart formatting.
What should you do?
You have a Microsoft Excel spreadsheet that contains the data shown in the following table.
You plan to build a data model for a Power Bl report.
You need to prepare the data so that it is available to the model in the format shown in the following table.
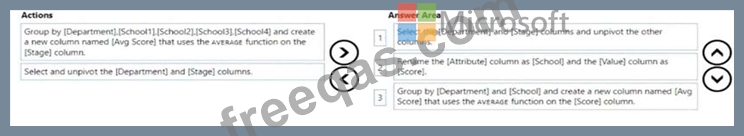
Which three actions should you perform in sequence in Power Query Editor? To answer, move the appropriate actions from the list of actions to the answer area and arrange them in the correct order.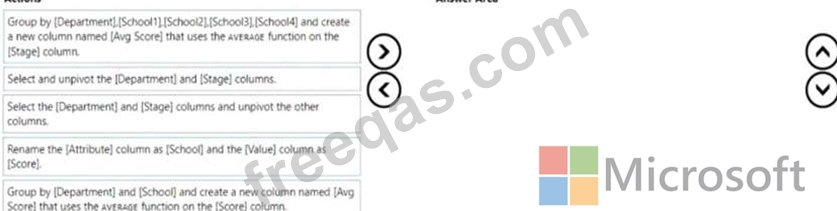

You have a query named Customer that imports CSV files from a data lake. The query contains 500 rows as shown in the exhibit. (Click the Exhibit tab.)
Each file contains deltas of any new or modified rows from each load to the data lake. Multiple files can have the same customer ID.
You need to keep only the last modified row for each customer ID.
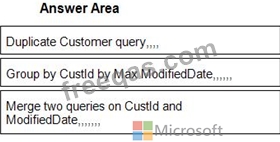
Which three actions should you perform in sequence? To answer, move the appropriate actions from the list of actions to the answer area and arrange them in the correct order.
DRAG DROP
You have the line chart shown in the exhibit. (Click the Exhibit tab.)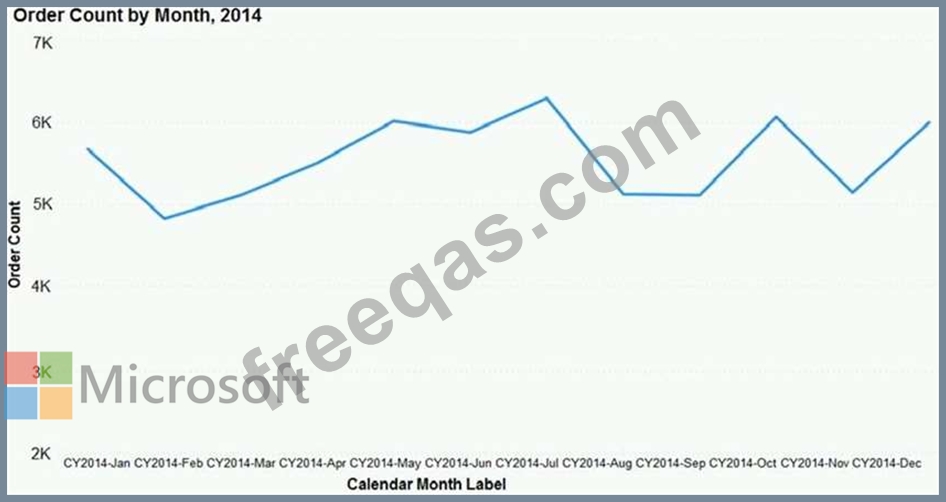
You need to modify the chart to meet the following requirements:
* Identify months that have order counts above the mean.
* Display the mean monthly order count.
Which three actions should you perform in sequence? To answer, move the appropriate actions from the list of actions to the answer area and arrange them in the correct order.

You have a dataset named Pens that contains the following columns:
Unit Price
Quantity Ordered
You need to create a visualization that shows the relationship between Unit Price and Quantity Ordered. The solution must highlight orders that have a similar unit price and ordered quantity.
Which type of visualization and which feature should you use? To answer, select the appropriate options in the answer area.
NOTE: Each correct selection is worth one point.

