You have a Power Bl report that contains a measure named Total Sales.
You need to create a new measure that will return the sum of Total Sates for a year up to a selected date. How should you complete the DAX expression? To answer, select the appropriate options in the answer area.
NOTE: Each correct selection is worth one point.

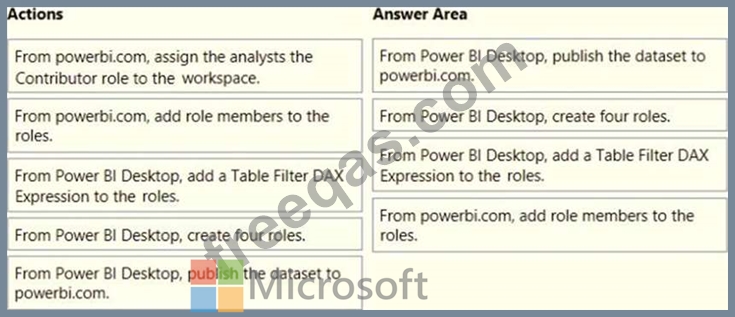
DRAG DROP
Once the profit and loss dataset is created, which four actions should you perform in sequence to ensure that the business unit analysts see the appropriate profit and loss data? To answer, move the appropriate actions from the list of actions to the answer area and arrange them in the correct order.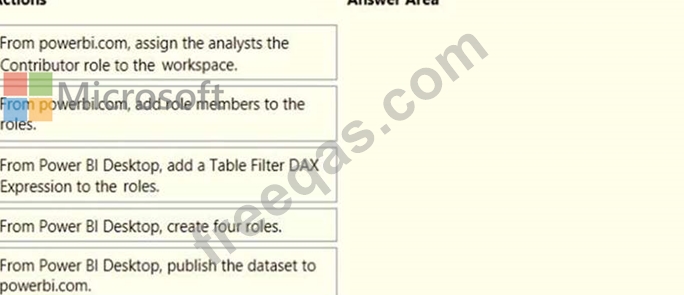
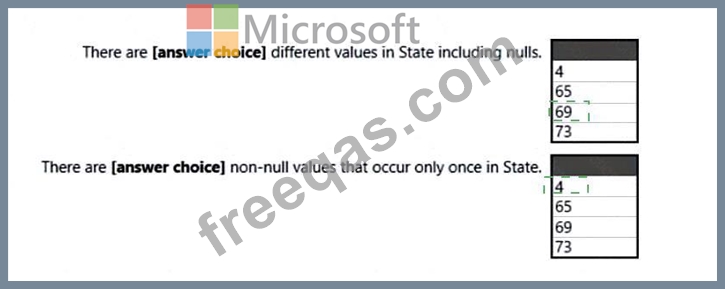
You are profiling data by using Power Query Editor.
You have a table named Reports that contains a column named State. The distribution and quality data metrics for the data m State is shown in the following exhibit.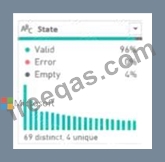
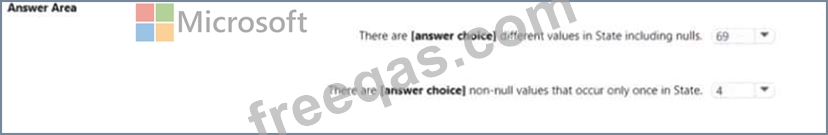
Use the drop-down menus to select the answer choice that completes each statement based on the information presented in the graphic.
NOTE: Each correct selection is worth one point.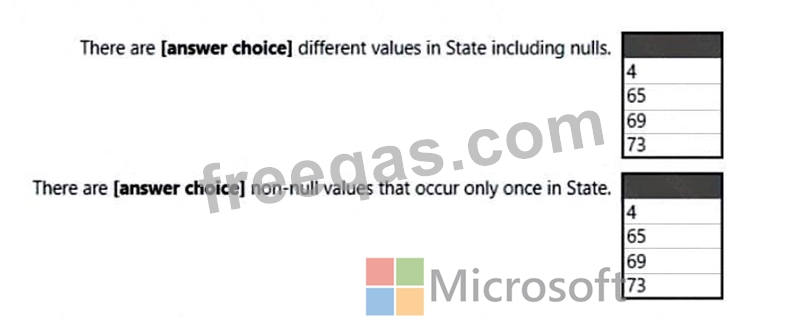
You are creating an analytics report that will consume data from the tables shown in the following table.
There is a relationship between the tables.
There are no reporting requirements on employeejd and employee_photo.
You need to optimize the data model
What should you configure for employeejd and employee.photo? To answer, select the appropriate options in the answer area.

You have the dashboard shown in the following exhibit.
You need to modify the dashboard to display as shown in the following exhibit.
What should you do?
