You have the Power Bl data model shown in the following exhibit.
You create two row-level security (RlS) roles named Manager and CFO.
You plan to publish the dataset to the Power Bl service.
You need to create DAX expressions for the RLS filters. The solution must meet the following requirements:
* Each manager must see only the data in the Sales and Human Resources tables for their own country.
* The CFO must be prevented from seeing the data in the Human Resources table.
* The CFO must see the sales data of all countries.
How should you complete the DAX expressions to meet the requirements? To answer, drag the appropriate expressions to the correct targets. Each expression may be used once, more than once, or not at all. You may need to drag the split bar between panes or scroll to view content.
NOTE: Each correct selection is worth one point.
The Country table contains the following data.
You plan to publish the dataset to the Power Bl service.
You need to create DAX expressions for the RLS filters. The solution must meet the following requirements:
* Each manager must see only the data in the Sales and Human Resources tables for their own country.
* The CFO must be prevented from seeing the data in the Human Resources table.
* The CFO must see the sales data of all countries.
How should you complete the DAX expressions to meet the requirements? To answer, drag the appropriate expressions to the correct targets. Each expression may be used once, more than once, or not at all. You may need to drag the split bar between panes or scroll to view content.
NOTE: Each correct selection is worth one point.

You need to create a relationship in the dataset for RLS.
What should you do? To answer select the appropriate options in the answer area.
NOTE: Each correct selection is worth one point.
You have the following table named Location.
The GeoCode column represents the country where each customer is located.
You create a map visualization as shown in the exhibit. (Click the Exhibit tab.)
You need to ensure that the map displays the country locations.
What should you do?
You need to calculate the last day of the month in the balance sheet data to ensure that you can relate the balance sheet data to the Date table. Which type of calculation and which formula should you use? To answer, select the appropriate options in the answer are a. NOTE: Each correct selection is worth one point.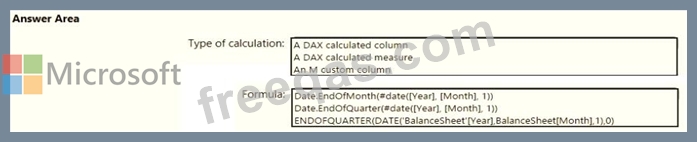


You have a Microsoft Power BI data model that contains three tables named Sales, Product, and Date.
The Sales table has an existing measure named [Total Sales] that sums the total sales from the Sales table.
You need to write a calculation that returns the percentage of total sales that a selected ProductCategoryName value represents. The calculation must respect any slicers on ProductCategoryName and must show the percentage of visible total sales. For example, if there are four ProductCategoryName values, and a user filters one out, a table showing ProductCategoryName and the calculation must sum up to 100 percent.
How should you complete the calculation? To answer, drag the appropriate values to the correct targets. Each value may be used once, more than once, or not at all. You may need to drag the split bar between panes or scroll to view content.
NOTE: Each correct selection is worth one point.


