You have the dashboard shown in the following exhibit.
You need to modify the dashboard to display as shown in the following exhibit.
What should you do?
ion have a Power BI dataset that contains a table named Temperature Readings. Temperature Readings contains the columns shown in the following table.
The table has 12 million rows. All the columns are needed for analysis.
You need to optimize the dataset to decrease the model size. The solution must not affect the precision of the data.
What should you do?
You have a power BI tenant that hosts the datasets shown in the following table.
You have the following requirements:
* The export of reports that contain Personally Identifiable Information (Pll) must be prevented.
* Data used for financial decisions must be reviewed and approved before use.
For each of the following statements, select Yes if the statement is true. Otherwise select No. NOTE: Each correct selection is worth one point

You are creating a Microsoft Power Bl model that has two tables named CityData and Sales. CityData contains only the data shown in the following table.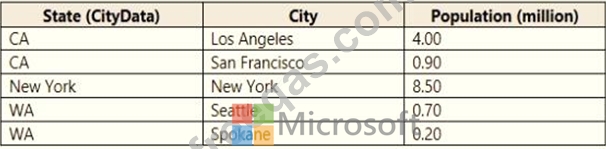
Sales contains only the data shown in the following table.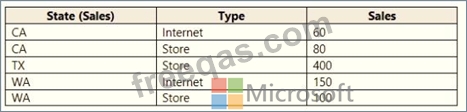
For each of the following statements, select Yes if the statement is true. Otherwise, select No.
NOTE: Each correct selection is worth one point.

You have a table that contains sales data and approximately 1,000 rows.
You need to identify outliers in the table.
Which type of visualization should you use?

