FreeQAs
 Request Exam  Contact
  • Home
  • View All Exams
  • New QA's
  • Upload
PRACTICE EXAMS:
  • Oracle
  • Fortinet
  • Juniper
  • Microsoft
  • Cisco
  • Citrix
  • CompTIA
  • VMware
  • ISC
  • SAP
  • EMC
  • PMI
  • HP
  • Salesforce
  • Other
  • Oracle
    Oracle
  • Fortinet
    Fortinet
  • Juniper
    Juniper
  • Microsoft
    Microsoft
  • Cisco
    Cisco
  • Citrix
    Citrix
  • CompTIA
    CompTIA
  • VMware
    VMware
  • ISC
    ISC
  • SAP
    SAP
  • EMC
    EMC
  • PMI
    PMI
  • HP
    HP
  • Salesforce
    Salesforce
  1. Home
  2. Tableau Certification
  3. Desktop-Specialist Exam
  4. Tableau.Desktop-Specialist.v2026-05-03.q171 Dumps
  • ««
  • «
  • …
  • 5
  • 6
  • 7
  • 8
  • 9
  • 10
  • 11
  • 12
  • 13
  • 14
  • …
  • »
  • »»
Download Now

Question 41

Which of the following are the options to export the data used to build the view / visualisations?

Correct Answer: D
Explanation
You can export the data in a Tableau data source, including all or part of the records from your original data.
Alternatively, you can export only the portion of data used to generate the view.
Since the question mentions the data used to build the view, we'll focus on that :
*Export data in the view to Microsoft Access or .csv*
Export the data that is used to generate the view as an Access database (Windows only) or .csv file (Mac only).
1) In Tableau Desktop, select Worksheet > Export > Data.
2) Select a location and type a name for your Access database or .csv file.
3) Click Save.
4) If you're on Windows, the Export Data to Access dialog box displays to give you the option to immediately use the new Access database and continue working in Access without interrupting your work flow.
insert code

Question 42

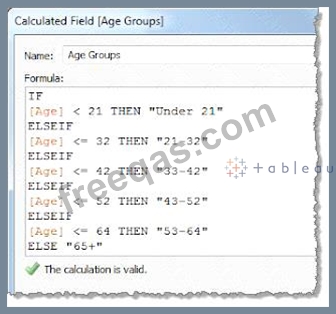
For creating variable sized bins we use __________________
Correct Answer: A
One way to view a measure in Tableau Desktop is to split it into bins. You can think of bins as buckets based on a range of values. For example, say you have a measure that represents age. Instead of aggregating the measure to calculate the average age, you can bin the measure to define age groups: 0-5, 6-10, 11-15, and so on. Then you can count the number of people in each age group.
Create a calculated field for variable bin size
Step 1
Select Analysis > Create Calculated Field.
Step 2
In the Calculated Field dialog box, complete the following steps:
insert code

Question 43

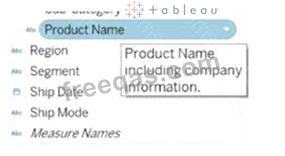
You want to provide additional information when hovering over a field in the Data pane as shown in the following exhibit.
What should you configure for the field?

Correct Answer: D
To provide additional information when hovering over a field in the Data pane, as shown in the exhibit, you need to configure a default comment for the field. This comment can be set by right-clicking on the field in the Data pane and selecting "Default Properties" and then "Comment." The text entered as a comment here will then be displayed as a tooltip when hovering over the field in the Data pane.
insert code

Question 44

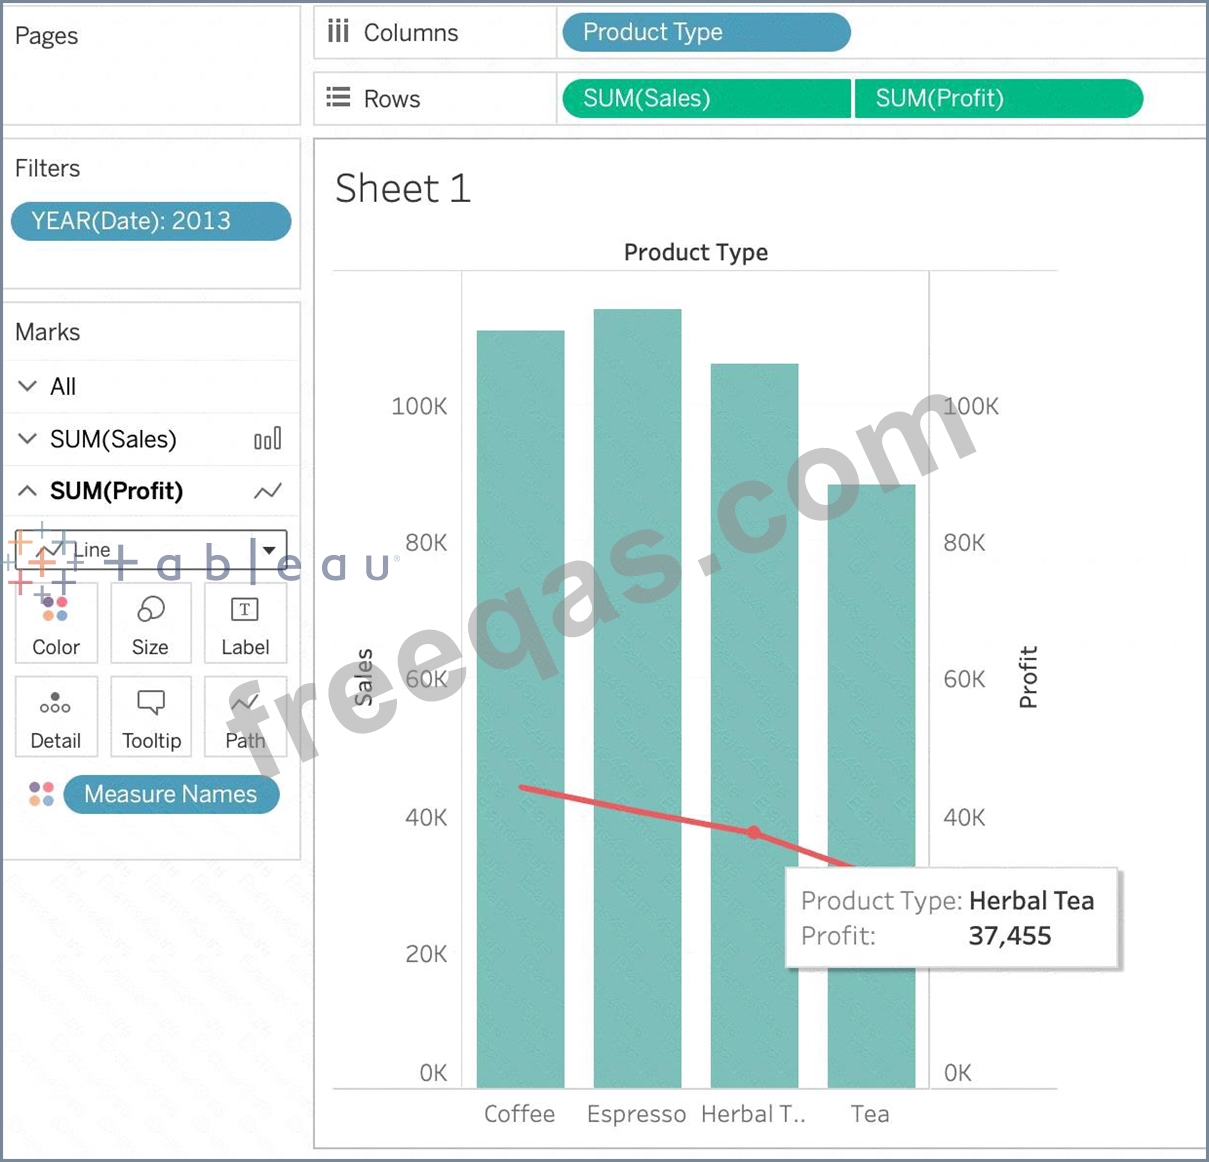
Using the CoffeeChain table, create a Dual Axis chart showing the Sales (Bar chart) and Profit (Line Chart) for each Product type. What was the Profit for the Herbal Tea product type in 2013?

Correct Answer: C
If you answered this question quickly and correctly, you're well prepared for the exam! Most students stumble while creating a Dual axis chart, so go ahead and give yourself a pat on the back!
To create a dual axis chart for the problem mentioned:
1) Drag Product Type to the column shelf, and Sales and Profit to the Row shelf:

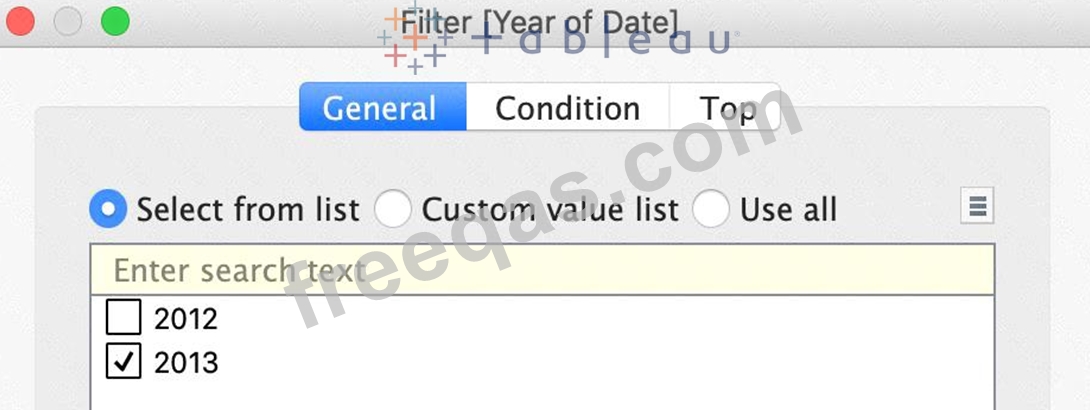
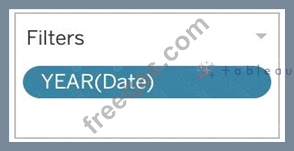
2) Now, to focus on 2013, drag Date to the filter shelf and select only 2013:


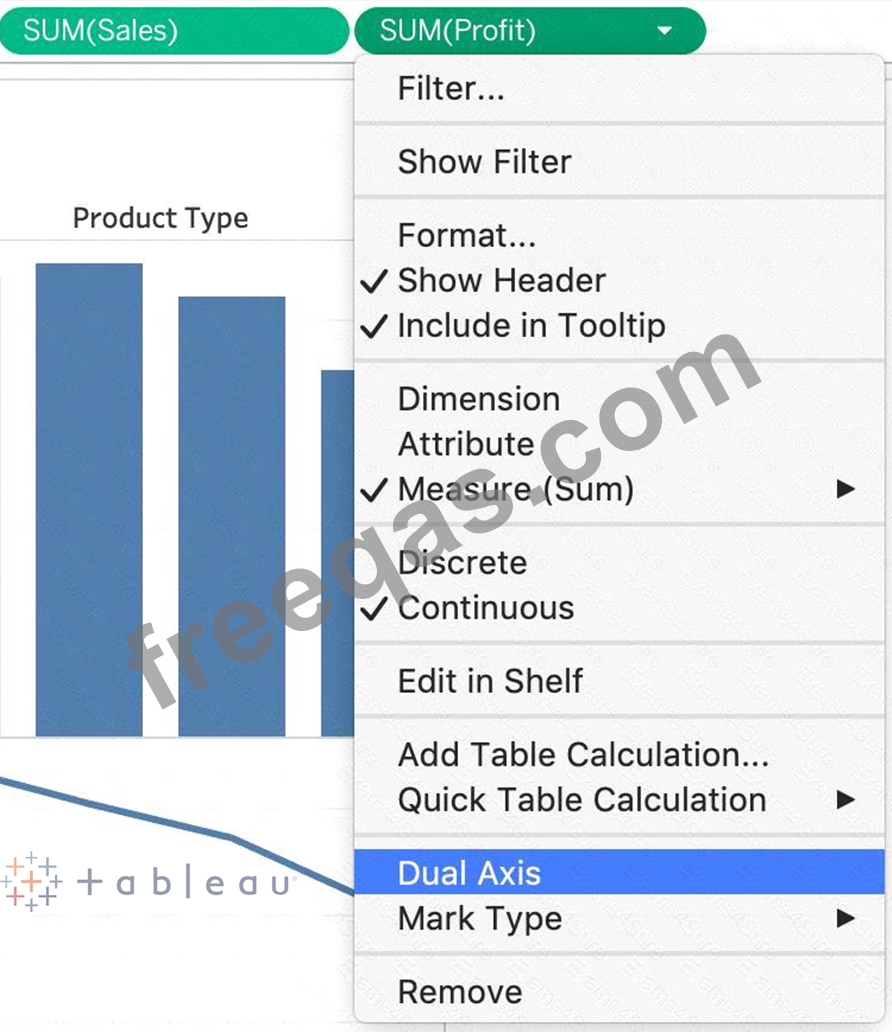
3) Now, click on the Profit pill in the Rows Shelf, and select dual axis:

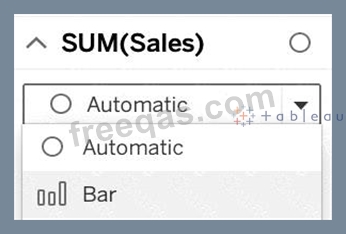
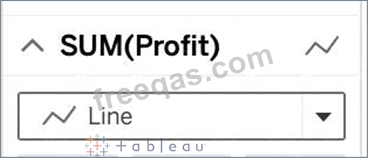
4) Now, in the marks shelf, choose Sales, and change the chart type to bar. Similarly, for Profit, change the chart type to Line.

Now the chart looks like this:

Now we change the Profit chart type to line:


5) Finally, we synchronise the axis as follows: Right click on the axis, and choose 'Synchronise axis'

And, our final view and answer is:
insert code

Question 45

Which two filter modes can you use with dimension filters? Choose two

Correct Answer: A,C
With dimension filters in Tableau, you can use several filter modes, including "Multiple Values (drop-down)" which allows users to select one or more values from a drop-down list of all the dimension's members.
Another mode is "Wildcard Match," which lets users filter the view by typing in a text box to match dimension members that contain the typed string. These filter types are particularly useful for string or categorical dimensions where users need to search or select specific members to display in the view.
insert code
  • ««
  • «
  • …
  • 5
  • 6
  • 7
  • 8
  • 9
  • 10
  • 11
  • 12
  • 13
  • 14
  • …
  • »
  • »»
[×]

Download PDF File

Enter your email address to download Tableau.Desktop-Specialist.v2026-05-03.q171 Dumps

Email:

FreeQAs

Our website provides the Largest and the most Latest vendors Certification Exam materials around the world.

Using dumps we provide to Pass the Exam, we has the Valid Dumps with passing guranteed just which you need.

  • DMCA
  • About
  • Contact Us
  • Privacy Policy
  • Terms & Conditions
©2026 FreeQAs

www.freeqas.com materials do not contain actual questions and answers from Cisco's certification exams.