FreeQAs
 Request Exam  Contact
  • Home
  • View All Exams
  • New QA's
  • Upload
PRACTICE EXAMS:
  • Oracle
  • Fortinet
  • Juniper
  • Microsoft
  • Cisco
  • Citrix
  • CompTIA
  • VMware
  • ISC
  • SAP
  • EMC
  • PMI
  • HP
  • Salesforce
  • Other
  • Oracle
    Oracle
  • Fortinet
    Fortinet
  • Juniper
    Juniper
  • Microsoft
    Microsoft
  • Cisco
    Cisco
  • Citrix
    Citrix
  • CompTIA
    CompTIA
  • VMware
    VMware
  • ISC
    ISC
  • SAP
    SAP
  • EMC
    EMC
  • PMI
    PMI
  • HP
    HP
  • Salesforce
    Salesforce
  1. Home
  2. Tableau Certification
  3. Desktop-Specialist Exam
  4. Tableau.Desktop-Specialist.v2026-05-03.q171 Dumps
  • ««
  • «
  • …
  • 9
  • 10
  • 11
  • 12
  • 13
  • 14
  • 15
  • 16
  • 17
  • 18
  • …
  • »
  • »»
Download Now

Question 61

Are animations enabled by default in Tableau?

Correct Answer: A
No, by default, animations are not enabled in Tableau.
We can animate visualizations to better highlight changing patterns in your data, reveal spikes and outliers, and see how data points cluster and separate.
Animations visually transition between filter, sort, and zoom settings, different pages, and changes to filter, parameter, and set actions. As visualizations animate in response to these changes, viewers can more clearly see how data differs, helping them make better informed decisions.
When you author animations, you can choose between two different styles: simultaneous or sequential. Here are examples of each type.
1) Simultaneous animations
The default simultaneous animations are faster and work well when showing value changes in simpler charts and dashboards.

2) Sequential animations
Sequential animations take more time but make complex changes clearer by presenting them step-by-step.

To Animate visualizations in a workbook:
1) Choose Format > Animations.
2) If you want to animate every sheet, under Workbook Default, click On. Then do the following:
For Duration, choose a preset, or specify a custom duration of up to 10 seconds.
For Style, choose Simultaneous to play all animations at once or Sequential to fade out marks, move and sort them, and then fade them in.
3) To override workbook defaults for a particular sheet, change the settings under Selected Sheet.
insert code

Question 62

True or False: Context Filters are executed after Data Source filters

Correct Answer: A
Explanation
THIS IS A VERY IMPORTANT QUESTION
To answer this question, you need to understand Tableau's Order of Operations. See below and remember this always:
insert code

Question 63

Using the dataset, plot a Map showing all the countries, filtered by Market to only include LATAM. Which country in the LATAM Market has the highest shipping delay (sum of total number of days between the order date and the ship date)?

Correct Answer: D
VERY IMPORTANT QUESTION FOR THE EXAM, PAY ATTENTION
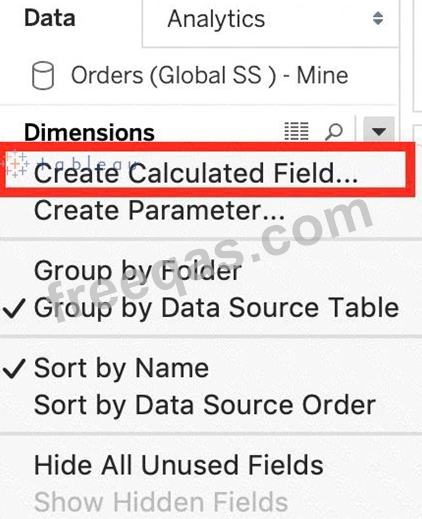
1) To find the number of days between order date and shipping date, we will make use of a calculated field:

In the data pane, click on the dropdown arrow, and choose create calculated field.
Let's name this calculated field "ShippingDelay" (you can name it anything you want :) )
2) Use the DATEDIFF() function, and pass it the arguments as follows:

'day' depicts that we want to calculate the number of DAYS between the two dates. The first argument is
'start_date' which is the ORDER_DATE (day the order was placed), the second argument is 'end_date', which is the SHIP_DATE (date the order was shipped). So by subtracting as follows: SHIP_DATE - ORDER_DATE, we can find the delay in shipping.
Click OK.
3) You should now have a new measure as follows:

4) Phew! The hard part is done! Now let's filter by Market to include only LATAM:

5) Drag Country to the view, and the new calculated field 'ShippingDelay' to SIZE on the Marks Shelf as follows:
*You can also click on Show Text Labels to be sure that you're choosing the Largest value*

Clearly, Mexico has the highest Shipping Delay!
insert code

Question 64

Which of the following are valid ways to show Mark Labels in the visualisation?

Correct Answer: A,B,D
The following showcase how you can show mark labels. Using the Sample Superstore dataset:
1) Let's create a Bar chart showing the sales for each sub-category:

2) Now you can show labels by:
2.1) Click on Show Mark Labels Icon in the Toolbar ( easiest )


2.2) Drag Sales to the Text icon in the Marks Card:
2.3) Click on Analysis -> Show mark labels from the Tableau menu bar:
insert code

Question 65

What are three ways to access bolding options for the text in a tooltip? Choose three.

Correct Answer: A,C,F
To access bolding options for the text in a tooltip in Tableau, you can:
Select Tooltip on the Marks card, which allows you to edit the tooltip for the specific marks.
Select Worksheet on the menu, and then Tooltip, to open the tooltip editor for the worksheet.
Right-click on the Field and select Format, which lets you format the text including bolding options in the tooltip.
insert code
  • ««
  • «
  • …
  • 9
  • 10
  • 11
  • 12
  • 13
  • 14
  • 15
  • 16
  • 17
  • 18
  • …
  • »
  • »»
[×]

Download PDF File

Enter your email address to download Tableau.Desktop-Specialist.v2026-05-03.q171 Dumps

Email:

FreeQAs

Our website provides the Largest and the most Latest vendors Certification Exam materials around the world.

Using dumps we provide to Pass the Exam, we has the Valid Dumps with passing guranteed just which you need.

  • DMCA
  • About
  • Contact Us
  • Privacy Policy
  • Terms & Conditions
©2026 FreeQAs

www.freeqas.com materials do not contain actual questions and answers from Cisco's certification exams.