FreeQAs
 Request Exam  Contact
  • Home
  • View All Exams
  • New QA's
  • Upload
PRACTICE EXAMS:
  • Oracle
  • Fortinet
  • Juniper
  • Microsoft
  • Cisco
  • Citrix
  • CompTIA
  • VMware
  • SAP
  • EMC
  • PMI
  • HP
  • Salesforce
  • Other
  • Oracle
    Oracle
  • Fortinet
    Fortinet
  • Juniper
    Juniper
  • Microsoft
    Microsoft
  • Cisco
    Cisco
  • Citrix
    Citrix
  • CompTIA
    CompTIA
  • VMware
    VMware
  • SAP
    SAP
  • EMC
    EMC
  • PMI
    PMI
  • HP
    HP
  • Salesforce
    Salesforce
  1. Home
  2. Tableau Certification
  3. TCC-C01 Exam
  4. Tableau.TCC-C01.v2025-10-01.q20 Dumps
  • «
  • 1
  • 2
  • 3
  • 4
  • 5
  • »
Download Now

Question 11

An executive-level workbook leverages 37 of the 103 fields included in a data source. Performance for the workbook is noticeably slower than other workbooks on the same Tableau Server.
What should the consultant do to improve performance of this workbook while following best practice?

Correct Answer: C
To improve the performance of a Tableau workbook, it is best practice to streamline the data being used. This can be achieved by using filters to limit the data to only what is necessary for analysis, hiding fields that are not being used to reduce the complexity of the data model, and aggregating values to simplify the data and reduce the number of rows that need to be processed. These steps can help reduce the load on the server and improve the speed of the workbook.
References:The best practices for optimizing workbook performance in Tableau are well-documented in Tableau's official resources, including the Tableau Help Guide and the Designing Efficient Workbooks whitepaper, which provide detailed recommendations on how to streamline workbooks for better performance12.
insert code

Question 12

From the desktop, open the CCworkbook. Use the US PopulationEstimates data source.
You need to shape the data in USPopulation Estimates by using TableauDesktop. The data must be formatted asshown in the following table.

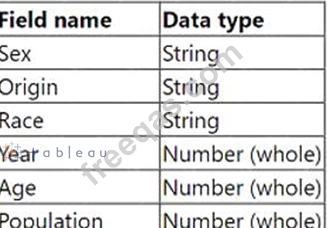
Open the Population worksheet. Enterthe total number of records contained inthe data set into the Total Recordsparameter.
From the File menu in Tableau Desktop,click Save.

Correct Answer:
See the complete Steps below in Explanation:
Explanation:
To shape the data in the "US Population Estimates" data source and enter the total number of records into the
"Total Records" parameter in Tableau Desktop, follow these steps:
* Open the CC Workbook and Access the Worksheet:
* From the desktop, double-click on the CC workbook to open it in Tableau Desktop.
* Navigate to the Population worksheet by selecting its tab at the bottom of the window.
* Format and Shape the Data:
* Ensure the data types match those specified in the requirements: Sex, Origin, Race as strings; Year, Age, Population as whole numbers.
* To verify or change the data type, click on the dropdown arrow next to each field name in the Data pane and select "Change Data Type" if necessary.
* Calculate Total Number of Records:
* Create a new calculated field named "Total Records". To do this, right-click in the Data pane and select "Create Calculated Field".
* Enter the formulaCOUNT([Record ID])orSUM([Number of Records])depending on how the data source identifies each row uniquely.
* Drag this new calculated field onto the worksheet to display the total number of records.
* Enter the Value into the Total Records Parameter:
* Locate the "Total Records" parameter in the Data pane. Right-click on the parameter and select
"Edit".
* Manually enter the number displayed from the calculated field into the parameter, ensuring accuracy to meet the data shaping requirement.
* Save Your Changes:
* From the File menu, click 'Save' to ensure all your changes are stored.
References:
* Tableau Desktop Guide: Provides detailed instructions on managing data types, creating calculated fields, and updating parameters.
* Tableau Data Shaping Techniques: Outlines effective methods for manipulating and structuring data for analysis.
This process will ensure the data in the "US Population Estimates" is accurately shaped according to the specified format and that the total number of records is correctly calculated and entered into the designated parameter. This thorough approach ensures data integrity and accuracy in reporting.
insert code

Question 13

A client is searching for ways to curate and document data in order to obtain data lineage. The client has a data source connected to a data lake.
Which tool should the consultant recommend to meet the client's requirements?

Correct Answer: B
To effectively curate and document data for obtaining data lineage, particularly from a data source connected to a data lake, the recommended tool is:
* Tableau Catalog with Tableau Data Management Add-on: This add-on enhances the capabilities of Tableau Catalog, providing extensive features for data management, including detailed data lineage, impact analysis, and metadata management.
* Functionality: The Tableau Catalog with the Data Management Add-on allows users to see the full history and lineage of the data, trace its usage across all Tableau content, and understand dependencies.
It also facilitates better governance and transparency in data handling.
* Why Choose this Tool: For a client needing comprehensive data lineage and documentation capabilities, this add-on ensures that data stewards and users can maintain and utilize a well-managed data environment. It supports robust data governance practices necessary for large and complex data ecosystems like those typically associated with data lakes.
ReferencesThe recommendation is based on the functionalities offered by the Tableau Data Management Add-on, as described in Tableau's official documentation on managing and documenting data sources for enhanced governance and operational efficiency.
insert code

Question 14

A client wants to flag orders that have sales higher than the regional average.
Which calculated field will produce the required result?

Correct Answer: C
To flag orders with sales higher than the regional average, the correct calculated field would compare the sum of sales for each order against the average sales of all orders within the same region:
* Correct Formula:{ FIXED [Order ID] : SUM([Sales]) } > { FIXED [Region] : AVG({ FIXED
[Order ID] : SUM([Sales]) }) }
* This calculation uses a Level of Detail (LOD) expression:
* The left part of the formula{ FIXED [Order ID] : SUM([Sales]) }calculates the total sales for each individual order.
* The right part{ FIXED [Region] : AVG({ FIXED [Order ID] : SUM([Sales]) }) }calculates the average sales per order within each region.
* The>operator is used to compare these two values to determine if the sales for each order exceed the regional average.
ReferencesThis formula utilizes Tableau's LOD expressions to perform complex comparisons across different dimensions of the data, as explained in Tableau's official training materials on LOD calculations.
insert code

Question 15

A client is working in Tableau Prep and has a field named Orderld that is compiled by country, year, and an order number as shown in the following table.

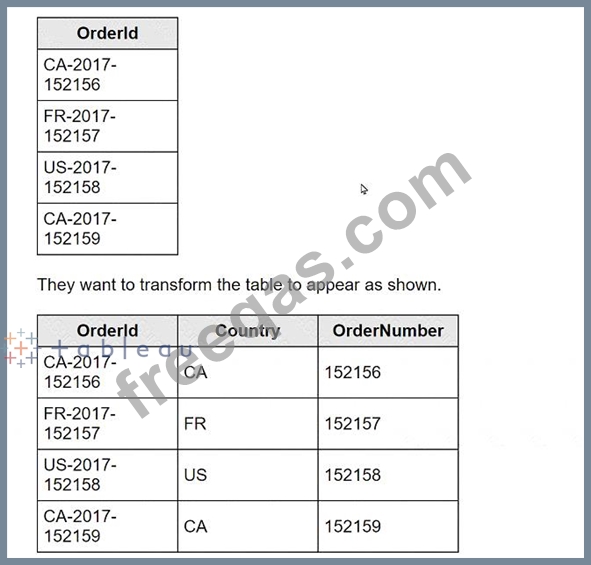
What should the consultant use to transform the table in the most efficient manner?

Correct Answer: C
To transform theOrderldfield in Tableau Prep, the Split option is the most efficient and straightforward method. Here's how you can apply it:
* In Tableau Prep, drag your dataset into the flow.
* Click on theOrderldfield in the workspace to select it.
* Look for the option in the toolbar that says "Split" and select it.
* Choose "Automatic Split" if the delimiters (such as hyphens) are consistent; Tableau Prep should automatically detect the hyphen as the delimiter and split theOrderldinto multiple new fields.
* The dataset should now show new columns: one for the country code (CA, FR, US), one for the year (2017), and one for the order number (152156, 152157, etc.).
The Split option works effectively here because it automatically identifies and uses the hyphen as the delimiter to divide the originalOrderldinto the desired components without manual specification of conditions or writing any formulas.
ReferencesThis procedure is based on the standard functionalities provided in Tableau Prep for splitting a field into multiple columns based on a delimiter, as described in the Tableau Prep user guide.
insert code
  • «
  • 1
  • 2
  • 3
  • 4
  • 5
  • »
[×]

Download PDF File

Enter your email address to download Tableau.TCC-C01.v2025-10-01.q20 Dumps

Email:

FreeQAs

Our website provides the Largest and the most Latest vendors Certification Exam materials around the world.

Using dumps we provide to Pass the Exam, we has the Valid Dumps with passing guranteed just which you need.

  • DMCA
  • About
  • Contact Us
  • Privacy Policy
  • Terms & Conditions
©2026 FreeQAs

www.freeqas.com materials do not contain actual questions and answers from Cisco's certification exams.