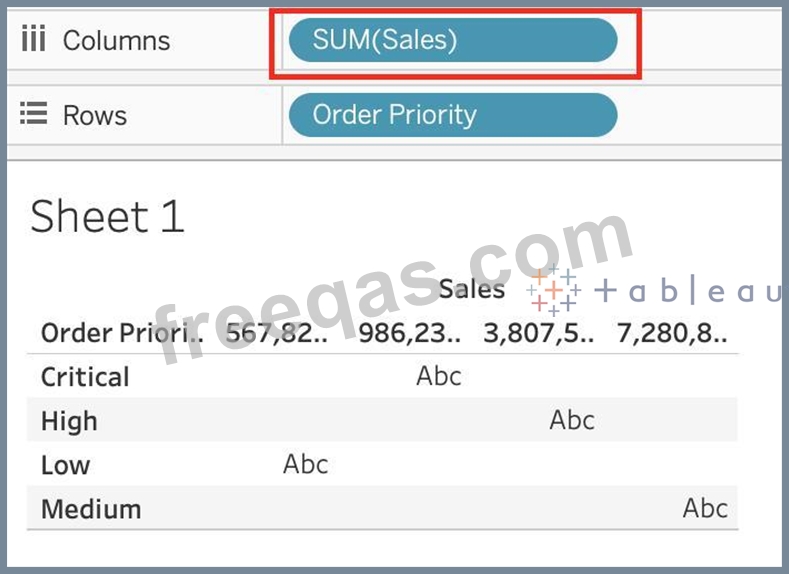
What are three options to change the scope of a reference line? Choose three.
Correct Answer: A,C,E
You can change the scope of a reference line by choosing one of the following options: Per Pane, Entire Table, or Per Cell. The scope determines how many reference lines are added to the view and how they are calculated. Per Pane adds one reference line for each pane in the view. Entire Table adds one reference line for the entire table in the view. Per Cell adds one reference line for each cell in the view
Question 77
Is it possible to make a Measure discrete?
Correct Answer: B
Explanation Of course! Follow along: Right click on any measure, and choose Discrete as shown: Once you do this, the green pill becomes blue in colour, indicating that it is now Discrete!
Question 78
How do you identify a continuous field in Tableau?
Correct Answer: C
When you connect to a new data source, Tableau assigns each field in the data source as dimension or measure in the Data pane, depending on the type of data the field contains. You use these fields to build views of your data.
Question 79
What is the following icon in the Data pane used to do? Larger image
Correct Answer: A
Explanation View Data allows you to inspect your data in a spreadsheet-like layout. You can view data either for the data source as a whole, or to see the underlying data for an individual mark or a group of marks. In a worksheet, the rows that you see in the View Data window are always scoped to the current selection or the current view. The View Data window displays as much of the data as possible by default, up to 10,000 rows. Field names are shown as column headers and can be dragged and dropped to change their display order. Click a column header to sort the values in that column. From the official website:
Question 80
Which three statements accurately describe dimensions? Choose three.
Correct Answer: A,B,D
Three statements that accurately describe dimensions are: Contain qualitative values Affect the level of detail in the view Can be continuous or discrete Dimensions are fields that contain qualitative values, such as names, dates, or geographical data. You can use dimensions to categorize, segment, and reveal the details in your data. Dimensions affect the level of detail in the view by creating headers or labels for marks or by defining how data is partitioned for table calculations. Dimensions can be continuous or discrete depending on their data type and format. Continuous dimensions are those that have an infinite range of possible values, such as numbers or ratios. Discrete dimensions are those that have a finite number of distinct values, such as names, categories, or dates3 The other options are not accurate statements about dimensions. Contain numeric, quantitative values is not correct, because fields that contain numeric, quantitative values are measures, not dimensions. Measures are fields that contain numeric values that you can measure and aggregate. Affect the formatting options in the view is not correct, because formatting options are not determined by dimensions, but rather by user preferences and choices. Formatting options allow you to change the appearance of various elements in the workbook, such as fonts, borders, shading, alignment, etc3