FreeQAs
 Request Exam  Contact
  • Home
  • View All Exams
  • New QA's
  • Upload
PRACTICE EXAMS:
  • Oracle
  • Fortinet
  • Juniper
  • Microsoft
  • Cisco
  • Citrix
  • CompTIA
  • VMware
  • ISC
  • SAP
  • EMC
  • PMI
  • HP
  • Salesforce
  • Other
  • Oracle
    Oracle
  • Fortinet
    Fortinet
  • Juniper
    Juniper
  • Microsoft
    Microsoft
  • Cisco
    Cisco
  • Citrix
    Citrix
  • CompTIA
    CompTIA
  • VMware
    VMware
  • ISC
    ISC
  • SAP
    SAP
  • EMC
    EMC
  • PMI
    PMI
  • HP
    HP
  • Salesforce
    Salesforce
  1. Home
  2. Tableau Certification
  3. TDS-C01 Exam
  4. Tableau.TDS-C01.v2024-01-19.q126 Dumps
  • «
  • 1
  • 2
  • 3
  • 4
  • 5
  • 6
  • 7
  • 8
  • 9
  • 10
  • …
  • »
  • »»
Download Now

Question 11

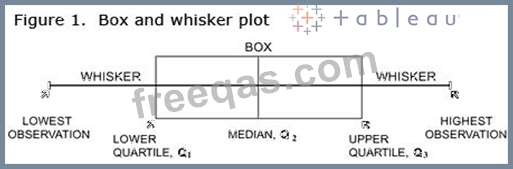
What does the box in a box plot represent?
Correct Answer: C
In a box and whisker plot:
1) The ends of the box are the upper and lower quartiles, so the box spans the interquartile range
2) The median is marked by a vertical line inside the box
3) The whiskers are the two lines outside the box that extend to the highest and lowest observations.
insert code

Question 12

To customize links based on the data in your dashboard, you can automatically enter field values as _______________ in URLs

Correct Answer: A
A URL action is a hyperlink that points to a web page, file, or other web-based resource outside of Tableau. You can use URL actions to create an email or link to additional information about your data. To customize links based on your data, you can automatically enter field values as parameters in URLs.
Read more in depth at : https://help.tableau.com/current/pro/desktop/en-us/actions_url.htm
insert code

Question 13

When using a Blend, what is the color of tick-mark on the primary and secondary data sources respectively?

Correct Answer: D
When using a Blend, the primary data source appears with a BLUE tick-mark and the secondary data source appears with a ORANGE tick-mark.
See below:
insert code

Question 14

Which of the following can you use to create a Histogram?
Correct Answer: B
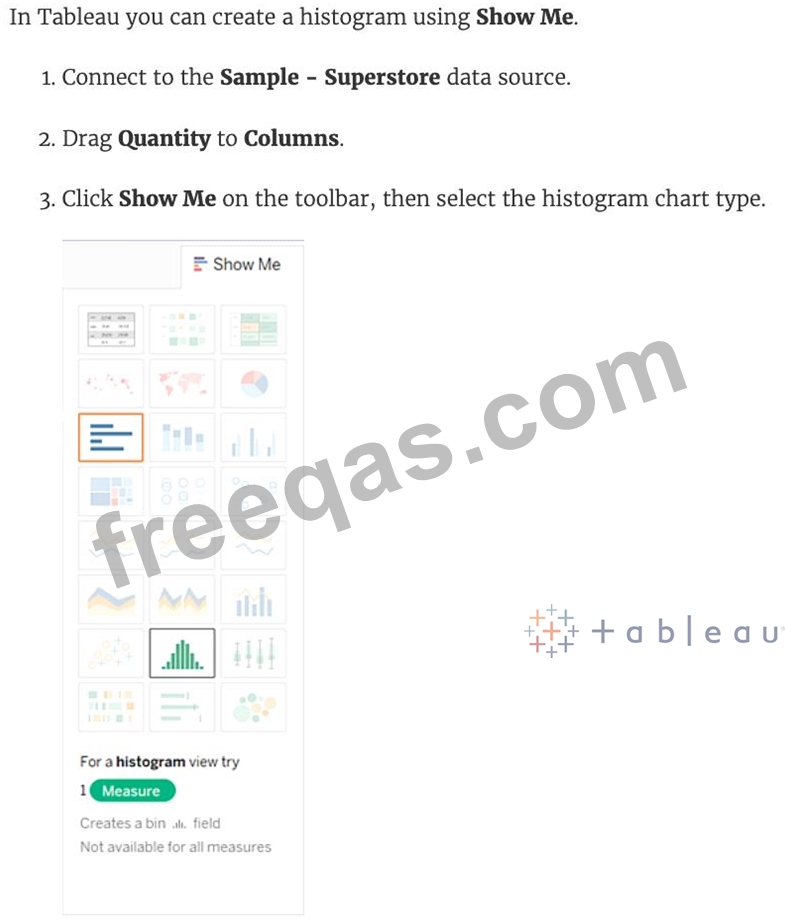
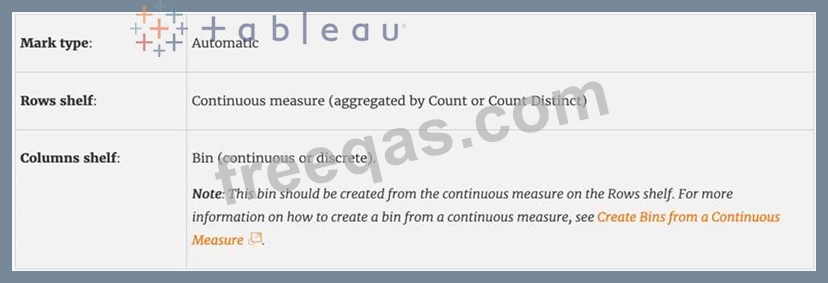
A histogram is a chart that displays the shape of a distribution. A histogram looks like a bar chart but groups values for a continuous measure into ranges, or bins.
The basic building blocks for a histogram are as follows:


Demo :
insert code

Question 15

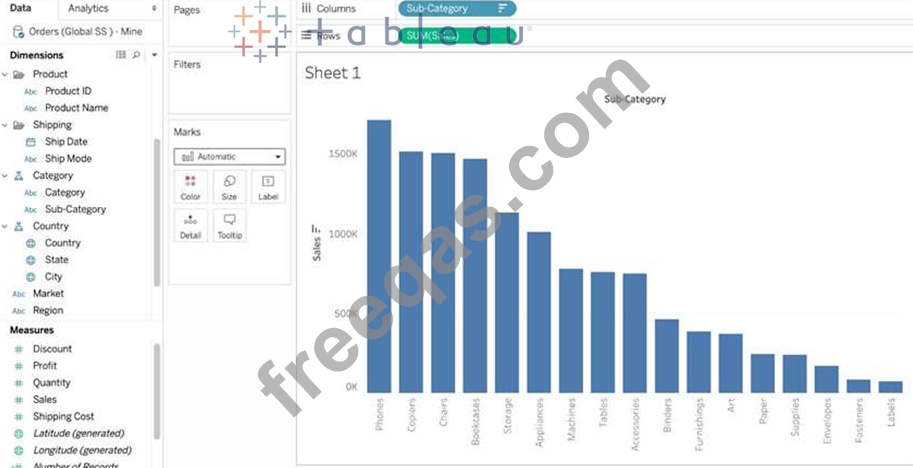
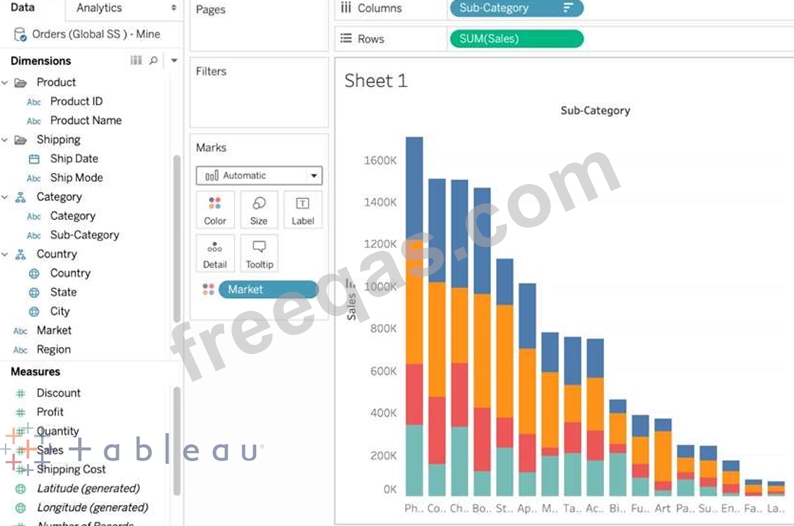
Suppose you create a bar chart by dragging a dimension to the Column shelf and a measure to the Rows shelf. Which of the following would create a stacked bar chart?
Correct Answer: C
Very important question for the exam and appears quite a lot too.
The correct answer is - By dragging another dimension to Color on the Marks card.

This is what the question says we have already created. Now to convert this into a Stacked bar chart, we will drop another dimension on Color in the Marks card.

The rest won't create stacked bar charts, and hence are incorrect choices. The best way to answer such questions on the real exam is to quickly do what the options say and see if they satisfy the requirements in the question.
insert code
  • «
  • 1
  • 2
  • 3
  • 4
  • 5
  • 6
  • 7
  • 8
  • 9
  • 10
  • …
  • »
  • »»
[×]

Download PDF File

Enter your email address to download Tableau.TDS-C01.v2024-01-19.q126 Dumps

Email:

FreeQAs

Our website provides the Largest and the most Latest vendors Certification Exam materials around the world.

Using dumps we provide to Pass the Exam, we has the Valid Dumps with passing guranteed just which you need.

  • DMCA
  • About
  • Contact Us
  • Privacy Policy
  • Terms & Conditions
©2026 FreeQAs

www.freeqas.com materials do not contain actual questions and answers from Cisco's certification exams.