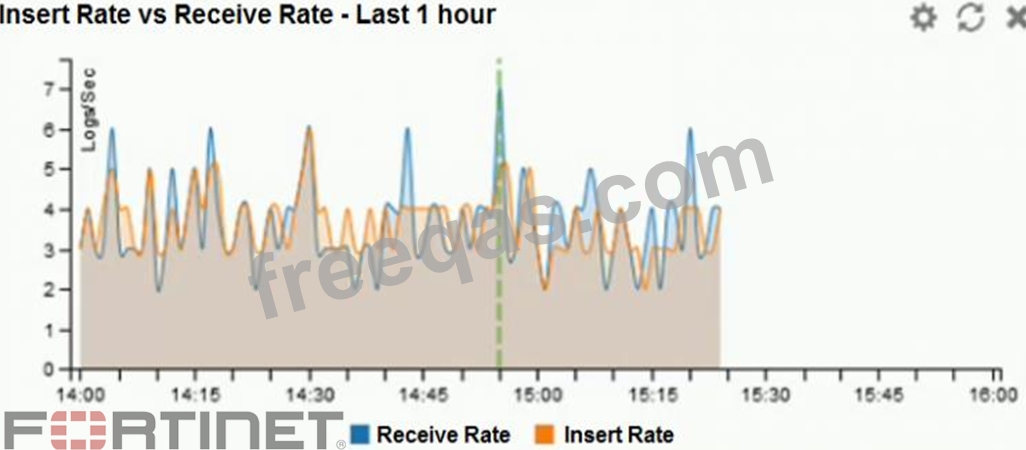
Refer to the exhibit. What does the data point at 14:55 tell you?
Correct Answer: A
Question 2
Which two statements are true regarding fabric connectors? (Choose two.)
Correct Answer: B,D
Question 3
Which statements are true regarding securing communications between FortiAnalyzer and FortiGate with IPsec? (Choose two.)
Correct Answer: C,D
Question 4
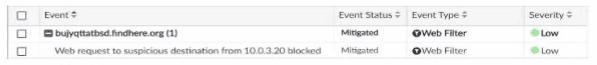
Exhibit. Which statement about the event displayed is correct?
Correct Answer: D
Question 5
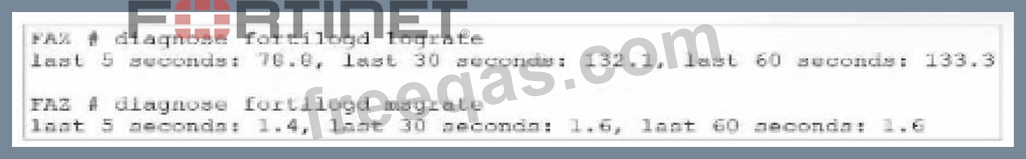
Exhibit. What can you conclude about the output?
Correct Answer: A
In this output, we see two diagnostic commands executed on a FortiAnalyzer device: * diagnose fortilogd lograte: This command shows the rate at which logs are being processed by the FortiAnalyzer in terms of log entries per second. * diagnose fortilogd msgrate: This command displays the message rate, or the rate at which individual messages are being processed. The values provided in the exhibit output show: * Log rate (lograte): Consistently high, showing values such as 70.0, 132.1, and 133.3 logs per second over different time intervals. * Message rate (msgrate): Lower values, around 1.4 to 1.6 messages per second. Explanation: * Interpretation of log rate vs. message rate: In FortiAnalyzer, the log rate typically refers to the rate of logs being stored or indexed, while the message rate refers to individual messages within these logs. Given that a single log entry can contain multiple messages, it's common to see a lower message rate relative to the log rate. * Understanding normal operation: In this case, the message rate being lower than the log rate is expected and typical behavior. This discrepancy can arise because each log entry may bundle multiple related messages, reducing the message rate relative to the log rate. Conclusion * Correct answer: A. The message rate being lower than the log rate is normal. * This aligns with the normal operational behavior of FortiAnalyzer in processing logs and messages. There is no indication that both logs and messages are nearly finished indexing, as that would typically show diminishing rates toward zero, which is not the case here. Additionally, there's no information in this output about specific ADOMs or a comparison between traffic logs and event logs. Thus, options B, C, and D are incorrect. References: FortiOS 7.4.1 and FortiAnalyzer 7.4.1 command guides for diagnose fortilogd lograte and diagnose fortilogd msgrate.