FreeQAs
 Request Exam  Contact
  • Home
  • View All Exams
  • New QA's
  • Upload
PRACTICE EXAMS:
  • Oracle
  • Fortinet
  • IBM
  • Juniper
  • Microsoft
  • Cisco
  • Citrix
  • CompTIA
  • VMware
  • ISC
  • SAP
  • EMC
  • PMI
  • HP
  • Salesforce
  • Other
  • Oracle
    Oracle
  • Fortinet
    Fortinet
  • IBM
    IBM
  • Juniper
    Juniper
  • Microsoft
    Microsoft
  • Cisco
    Cisco
  • Citrix
    Citrix
  • CompTIA
    CompTIA
  • VMware
    VMware
  • ISC
    ISC
  • SAP
    SAP
  • EMC
    EMC
  • PMI
    PMI
  • HP
    HP
  • Salesforce
    Salesforce
  1. Home
  2. Microsoft Certification
  3. DP-600 Exam
  4. Microsoft.DP-600.v2024-08-05.q47 Dumps
  • «
  • 1
  • 2
  • 3
  • 4
  • 5
  • 6
  • 7
  • 8
  • 9
  • 10
  • …
  • »
  • »»
Download Now

Question 6

You have a Fabric warehouse that contains a table named Sales.Orders. Sales.Orders contains the following columns.

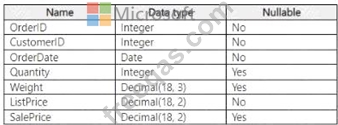
You need to write a T-SQL query that will return the following columns.

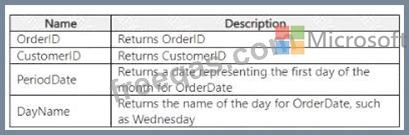
How should you complete the code? To answer, select the appropriate options in the answer area.
NOTE: Each correct selection is worth one point.

Correct Answer:

Explanation:

For the PeriodDate that returns the first day of the month for OrderDate, you should use DATEFROMPARTS as it allows you to construct a date from its individual components (year, month, day).
For the DayName that returns the name of the day for OrderDate, you should use DATENAME with the weekday date part to get the full name of the weekday.
The complete SQL query should look like this:
SELECT OrderID, CustomerID,
DATEFROMPARTS(YEAR(OrderDate), MONTH(OrderDate), 1) AS PeriodDate,
DATENAME(weekday, OrderDate) AS DayName
FROM Sales.Orders
Select DATEFROMPARTS for the PeriodDate and weekday for the DayName in the answer area.
insert code

Question 7

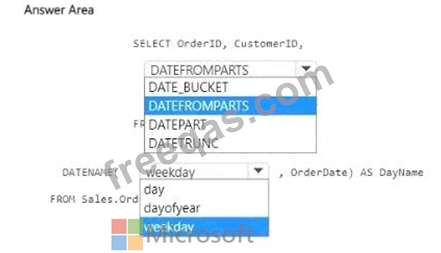
You have a Fabric tenant that contains a warehouse named Warehouse1. Warehouse1 contains a fact table named FactSales that has one billion rows. You run the following T-SQL statement.
CREATE TABLE test.FactSales AS CLONE OF Dbo.FactSales;
For each of the following statements, select Yes if the statement is true. Otherwise, select No. NOTE: Each correct selection is worth one point.

Correct Answer:
insert code

Question 8

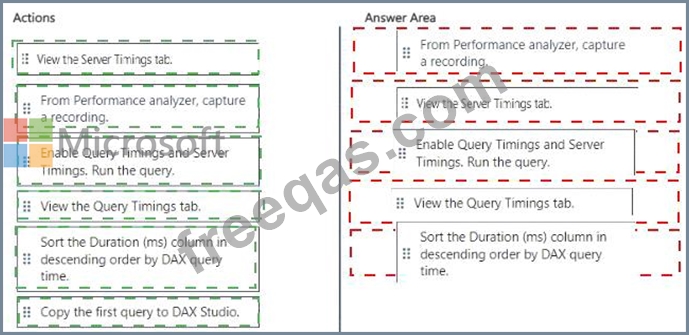
You have a Fabric tenant that contains a Microsoft Power Bl report named Report 1.
Report1 is slow to render. You suspect that an inefficient DAX query is being executed.
You need to identify the slowest DAX query, and then review how long the query spends in the formula engine as compared to the storage engine.
Which five actions should you perform in sequence? To answer, move the appropriate actions from the list of actions to the answer area and arrange them in the correct order.

Correct Answer:

Explanation:
To identify the slowest DAX query and analyze the time it spends in the formula engine compared to the storage engine, you should perform the following actions in sequence:
* From Performance analyzer, capture a recording.
* View the Server Timings tab.
* Enable Query Timings and Server Timings. Run the query.
* View the Query Timings tab.
* Sort the Duration (ms) column in descending order by DAX query time.
insert code

Question 9

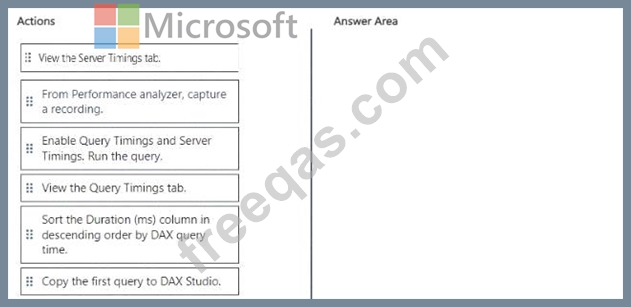
You have a Fabric tenant that contains a warehouse.
A user discovers that a report that usually takes two minutes to render has been running for 45 minutes and has still not rendered.
You need to identify what is preventing the report query from completing.
Which dynamic management view (DMV) should you use?

Correct Answer: D
insert code

Question 10

You have a Microsoft Fabric tenant that contains a dataflow.
You are exploring a new semantic model.
From Power Query, you need to view column information as shown in the following exhibit.

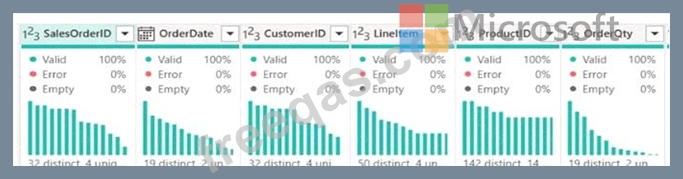
Which three Data view options should you select? Each correct answer presents part of the solution. NOTE:
Each correct answer is worth one point.

Correct Answer: A,B,E
To view column information like the one shown in the exhibit in Power Query, you need to select the options that enable profiling and display quality and distribution details. These are: A. Enable column profile - This option turns on profiling for each column, showing statistics such as distinct and unique values. B. Show column quality details - It displays the column quality bar on top of each column showing the percentage of valid, error, and empty values. E. Show column value distribution - It enables the histogram display of value distribution for each column, which visualizes how often each value occurs.
References: These features and their descriptions are typically found in the Power Query documentation, under the section for data profiling and quality features.
insert code
  • «
  • 1
  • 2
  • 3
  • 4
  • 5
  • 6
  • 7
  • 8
  • 9
  • 10
  • …
  • »
  • »»
[×]

Download PDF File

Enter your email address to download Microsoft.DP-600.v2024-08-05.q47 Dumps

Email:

FreeQAs

Our website provides the Largest and the most Latest vendors Certification Exam materials around the world.

Using dumps we provide to Pass the Exam, we has the Valid Dumps with passing guranteed just which you need.

  • DMCA
  • About
  • Contact Us
  • Privacy Policy
  • Terms & Conditions
©2026 FreeQAs

www.freeqas.com materials do not contain actual questions and answers from Cisco's certification exams.