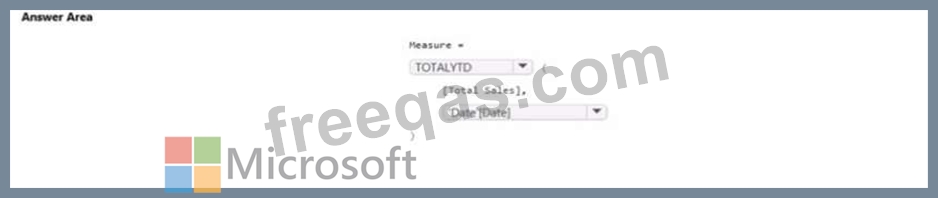
You have a Power Bl report that contains a measure named Total Sales.
You need to create a new measure that will return the sum of Total Sates for a year up to a selected date. How should you complete the DAX expression? To answer, select the appropriate options in the answer area.
NOTE: Each correct selection is worth one point.
You have a Power Bl report that contains a page. The page contains the following:
* A shape named Shape 1
* A card named Sales Summary
* A clustered bar chart named Sales by Region
You need to ensure that Sales Summary renders on top of Shape 1. What should you modify?

You need to create a visual as shown in the following exhibit.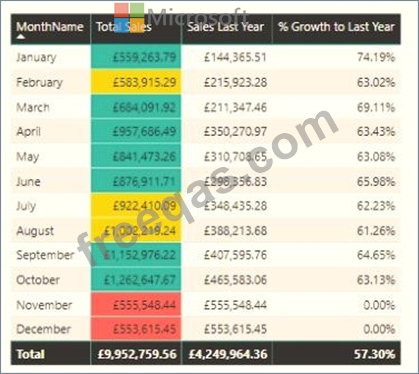
The indicator color for Total Sales will be based on % Growth to Last Year.
The solution must use the existing calculations only.
How should you configure the visual? To answer, select the appropriate options in the answer area.
NOTE: Each correct selection is worth one point.

You build a Power Bi report that displays loT temperature data streaming from a refrigerator.
You publish the report to the Power BI service.
You need to be notified when the temperature rises above four degrees Celsius.
What should you do?
You have a Power BI report.
You need to create a calculated table to return the 100 highest spending customers.
How should you complete the DAX expression? To answer, select the appropriate options in the answer area.
NOTE: Each correct selection is worth one point.

