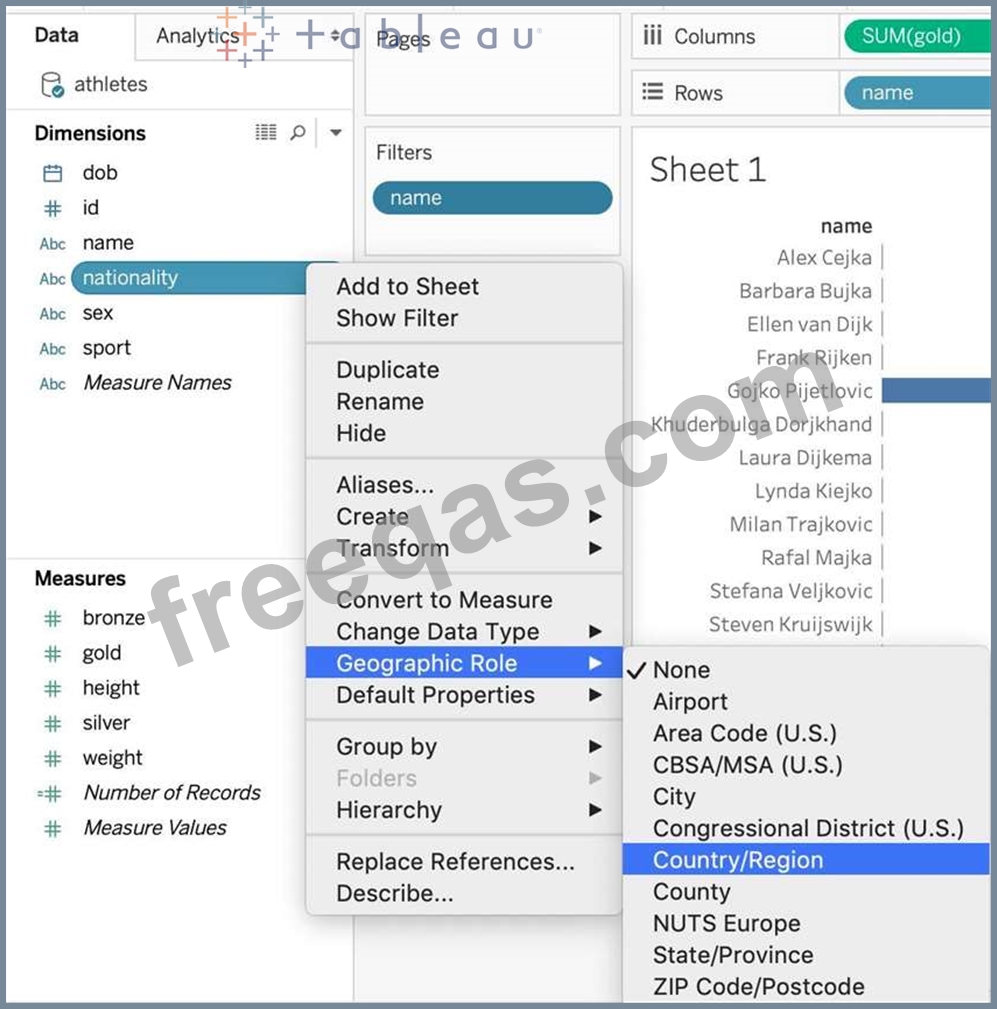
How can you MANUALLY assign geographic roles to a dimension from the data pane?
Correct Answer: B
Explanation From the data pane, simply right click on the dimension, choose geographic role, and then select the appropriate role as follows:
Question 122
How does Tableau know at which level to aggregate values?
Correct Answer: A
In Tableau, you can aggregate measures or dimensions, though it is more common to aggregate measures. Whenever you add a measure to your view, an aggregation is applied to that measure by default. The type of aggregation applied varies depending on the context of the view. When you add a measure to the view, Tableau automatically aggregates its values. Sum, average, and median are common aggregations; for a complete list, see List of Predefined Aggregations in Tableau. The current aggregation appears as part of the measure's name in the view. For example, Sales becomes SUM(Sales). Every measure has a default aggregation which is set by Tableau when you connect to a data source. You can view or change the default aggregation for a measure-see Set the Default Aggregation for a Measure. You can change the aggregation for a measure in the view from its context menu:
Question 123
What are two examples of a date value? Choose two.
Correct Answer: A,D
Date values in Tableau represent specific points in time and are typically formatted in a standard date format. Option A, "2020-05-01", is a standard date format representing the 1st of May, 2020. Option D, "January 1, 1995", is another example of a date value, representing the 1st of January, 1995. Options B ("December") and C ("Wednesday") represent a month and a day of the week, respectively, but do not specify a particular date.
Question 124
You need to access options to change a dimension's color palette. In addition to the Marks card, what else can you use?
Correct Answer: A
You can use the Color legend to access options to change a dimension's color palette, in addition to the Marks card. The Color legend shows the colors assigned to each member of the dimension in the view. You can right-click on the Color legend and select Edit Colors to open the Edit Colors dialog box, where you can change the color palette, assign specific colors to dimension members, or edit the color transparency and border6 The other options are not valid ways to change a dimension's color palette. Edit in Shelf is a feature that allows you to edit the fields on the Rows or Columns shelves by typing directly on the shelf. It does not affect the color palette of the dimension7 The Format menu allows you to change the appearance of various elements in the workbook, such as fonts, borders, shading, alignment, etc. It does not have options for changing the color palette of the dimension8 Edit Caption is a feature that allows you to add or edit a caption for a worksheet or dashboard. It does not affect the color palette of the dimension
Question 125
You need to uniformly change the size for all marks in a view. What should you do?
Correct Answer: D
You should select Size on the Marks card and use the slider to adjust the size to uniformly change the size for all marks in a view. The Size property on the Marks card allows you to control the size of marks in the view by moving the slider to the left or right. The Size slider affects different marks in different ways, such as making them bigger or smaller, wider or narrower, or thicker or thinner1 The other options are not valid ways to uniformly change the size for all marks in a view. Selecting Label on the Marks card and then selecting Alignment will allow you to change the position of labels on marks, not the size of marks2 Using the Fit dropdown menu on the toolbar will allow you to change how the view fits within the worksheet, not the size of marks3 Selecting Format on the menu, and then selecting Cell Size will allow you to change the height and width of cells in a text table, not the size of marks in other types of views4