FreeQAs
 Request Exam  Contact
  • Home
  • View All Exams
  • New QA's
  • Upload
PRACTICE EXAMS:
  • Oracle
  • Fortinet
  • IBM
  • Juniper
  • Microsoft
  • Cisco
  • Citrix
  • CompTIA
  • VMware
  • ISC
  • SAP
  • EMC
  • PMI
  • HP
  • Salesforce
  • Other
  • Oracle
    Oracle
  • Fortinet
    Fortinet
  • IBM
    IBM
  • Juniper
    Juniper
  • Microsoft
    Microsoft
  • Cisco
    Cisco
  • Citrix
    Citrix
  • CompTIA
    CompTIA
  • VMware
    VMware
  • ISC
    ISC
  • SAP
    SAP
  • EMC
    EMC
  • PMI
    PMI
  • HP
    HP
  • Salesforce
    Salesforce
  1. Home
  2. Tableau Certification
  3. Desktop-Specialist Exam
  4. Tableau.Desktop-Specialist.v2024-05-11.q146 Dumps
  • ««
  • «
  • …
  • 22
  • 23
  • 24
  • 25
  • 26
  • 27
  • 28
  • 29
  • 30
  • 31
  • »
Download Now

Question 126

______________ refers to the level of detail for a piece of data, wherever you are looking.

Correct Answer: B
Explanation
Data is generated and analyzed at many different levels of granularity. Granularity is the level of detail of the data. For example, when looking at graduation data, granularity would describe whether a row in the data set represents a single person or the graduating class of a university.
insert code

Question 127

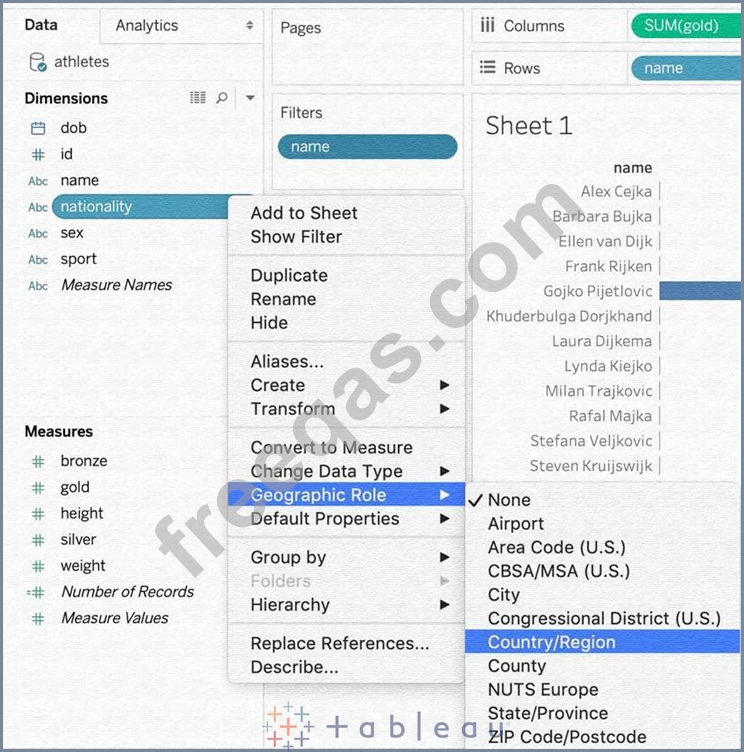
How can you MANUALLY assign geographic roles to a dimension from the data pane?

Correct Answer: B
From the data pane, simply right click on the dimension, choose geographic role, and then select the appropriate role as follows:
insert code

Question 128

Which of the following is a compelling reason to export a sheet in Tableau to a PDF?

Correct Answer: A
Exporting the visualisation gives us a static view of the visualisation.
It is NOT possible to interact with it, use filters, or dynamically enter anything in a visualisation exported PDF.
In Tableau Desktop, you can save views as PDF files rather than printing them as hard copies. You do not need to have Adobe Acrobat installed on your computer.
When you print an individual sheet to PDF, filters in the view are not included. To show filters, create a dashboard containing the sheet and export the dashboard to PDF. (IMPORTANT)
insert code

Question 129

You want to add Custom shapes to your visualisation. Where can you add these new shapes?

Correct Answer: D
Explanation
Here's how to add image files to your repository:
1) Find image file on the internet. I try to find consistent image formats if I plan to use a set of shapes such as logos or flags.
2) Download the image to your computer.
3) Drag images into your My Documents -> My Tableau repository -> Shapes folder.
4) Open Tableau and your new shapes will automatically be included in your "edit shapes" menu.
insert code

Question 130

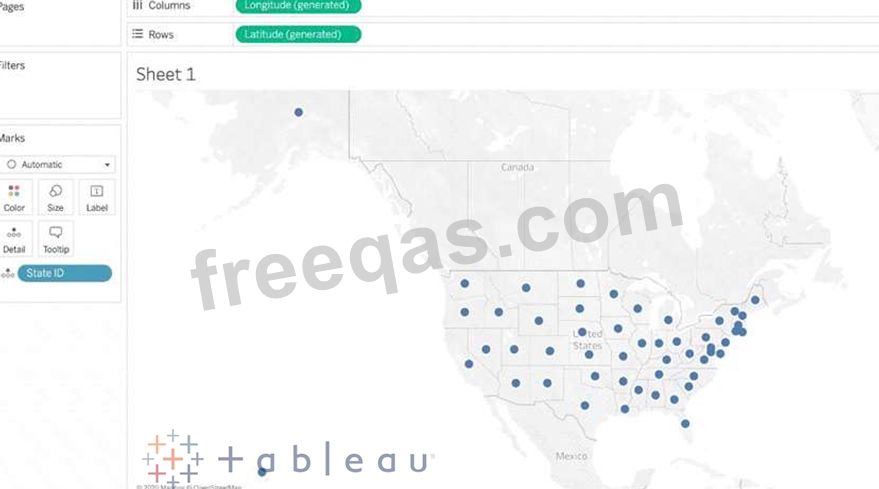
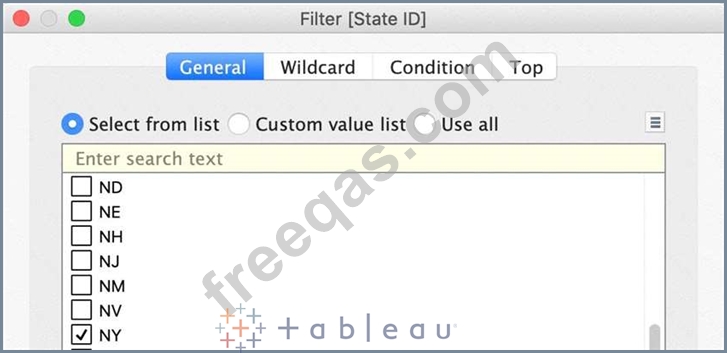
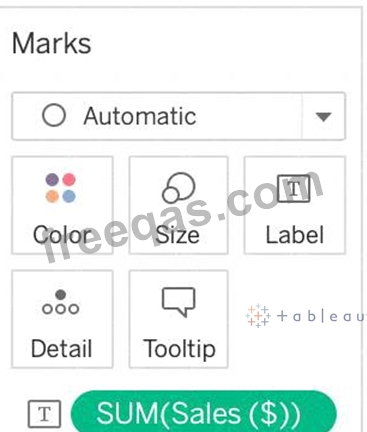
Using the Geo Data Table, create a Map showing Sales made per State. For the State of New York (NY), what was the amount in Sales ($) made for Phone Assortments with White color?

Correct Answer: A
Phew! Tricky one! You needed to use filters in this one.
Follow along:

2) Next, as the question mentions, we need to focus on the Assortment PHONE, the color WHITE, and the state of NEW YORK. -> so we use filters for this!
i) First drag Assortment to Filters, and select only Phones :

ii) Next, drag Color to Filters and Choose only White:

iii) Next, drag State ID to Filters, and choose New York (NY):


And Voila! We have our answer as follows:

iv) Last, drag Sales to Label:
insert code
  • ««
  • «
  • …
  • 22
  • 23
  • 24
  • 25
  • 26
  • 27
  • 28
  • 29
  • 30
  • 31
  • »
[×]

Download PDF File

Enter your email address to download Tableau.Desktop-Specialist.v2024-05-11.q146 Dumps

Email:

FreeQAs

Our website provides the Largest and the most Latest vendors Certification Exam materials around the world.

Using dumps we provide to Pass the Exam, we has the Valid Dumps with passing guranteed just which you need.

  • DMCA
  • About
  • Contact Us
  • Privacy Policy
  • Terms & Conditions
©2026 FreeQAs

www.freeqas.com materials do not contain actual questions and answers from Cisco's certification exams.