FreeQAs
 Request Exam  Contact
  • Home
  • View All Exams
  • New QA's
  • Upload
PRACTICE EXAMS:
  • Oracle
  • Fortinet
  • IBM
  • Juniper
  • Microsoft
  • Cisco
  • Citrix
  • CompTIA
  • VMware
  • ISC
  • SAP
  • EMC
  • PMI
  • HP
  • Salesforce
  • Other
  • Oracle
    Oracle
  • Fortinet
    Fortinet
  • IBM
    IBM
  • Juniper
    Juniper
  • Microsoft
    Microsoft
  • Cisco
    Cisco
  • Citrix
    Citrix
  • CompTIA
    CompTIA
  • VMware
    VMware
  • ISC
    ISC
  • SAP
    SAP
  • EMC
    EMC
  • PMI
    PMI
  • HP
    HP
  • Salesforce
    Salesforce
  1. Home
  2. Tableau Certification
  3. Desktop-Specialist Exam
  4. Tableau.Desktop-Specialist.v2024-05-11.q146 Dumps
  • ««
  • «
  • …
  • 22
  • 23
  • 24
  • 25
  • 26
  • 27
  • 28
  • 29
  • 30
  • 31
  • »
Download Now

Question 136

Which of the following is an example of a Date Part?

Correct Answer: D
All answers except November are examples of Date Values (continuous in nature).
See below:

You can see that the option in Green symbolizes our correct answer, i.e only a Month. In our case that month is November (the correct answer).
All other options are combinations of a year with one other value (like a month, quarter, or day). So this is how by looking at an option you can know if its a date part or date value!
insert code

Question 137

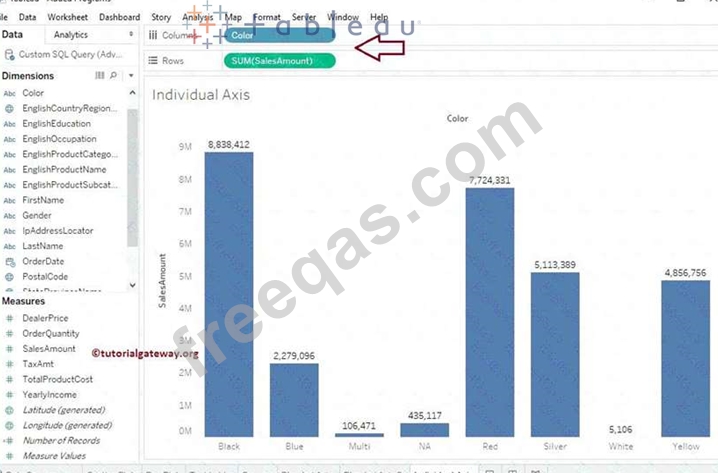
When is an axis created for the visualisation in Tableau?

Correct Answer: D
An Individual Axis in Tableau is obtained by adding a continuous into Rows or Columns Shelf.
Example:
In order to show Individual Axis in Tableau First, we drag and drop the Color from Dimension shelf to Column Shelf. Next, we drag and drop the Sales Amount from measures shelf to Rows Shelf. Since it is a continuous value, the Sales Amount will be aggregated to default Sum. Once you drag them, following Chart report will be generated.

Next, we drag and Drop one more measure value, i.e., Total Product Cost from Measures Region to Rows Shelf. Because it is a Measure value, Total Product Cost is aggregated to default Sum. From the below screenshot, you can observe that Tableau has created an individual axis for each measure (continuous field).
insert code

Question 138

Which of the following returns the Absolute Value of a given number?

Correct Answer: A
From the official Tableau website:


insert code

Question 139

Which of the following chart type makes use of 'binned' data?

Correct Answer: C
A histogram is a chart that displays the shape of a distribution. A histogram looks like a bar chart but groups values for a continuous measure into ranges, or bins.
insert code

Question 140

As a general best practice, how many categories can a pie chart display effectively?

Correct Answer: A
As a general best practice, your pie chart should contain 2 to 5 categories. Anything more than that is not easy for the eyes to distinguish. This is a common question and mentioned in Tableau's own eLearning module as well!
See how to build a pie chart:
insert code
  • ««
  • «
  • …
  • 22
  • 23
  • 24
  • 25
  • 26
  • 27
  • 28
  • 29
  • 30
  • 31
  • »
[×]

Download PDF File

Enter your email address to download Tableau.Desktop-Specialist.v2024-05-11.q146 Dumps

Email:

FreeQAs

Our website provides the Largest and the most Latest vendors Certification Exam materials around the world.

Using dumps we provide to Pass the Exam, we has the Valid Dumps with passing guranteed just which you need.

  • DMCA
  • About
  • Contact Us
  • Privacy Policy
  • Terms & Conditions
©2026 FreeQAs

www.freeqas.com materials do not contain actual questions and answers from Cisco's certification exams.