FreeQAs
 Request Exam  Contact
  • Home
  • View All Exams
  • New QA's
  • Upload
PRACTICE EXAMS:
  • Oracle
  • Fortinet
  • Juniper
  • Microsoft
  • Cisco
  • Citrix
  • CompTIA
  • VMware
  • ISC
  • SAP
  • EMC
  • PMI
  • HP
  • Salesforce
  • Other
  • Oracle
    Oracle
  • Fortinet
    Fortinet
  • Juniper
    Juniper
  • Microsoft
    Microsoft
  • Cisco
    Cisco
  • Citrix
    Citrix
  • CompTIA
    CompTIA
  • VMware
    VMware
  • ISC
    ISC
  • SAP
    SAP
  • EMC
    EMC
  • PMI
    PMI
  • HP
    HP
  • Salesforce
    Salesforce
  1. Home
  2. WGU Certification
  3. Applied-Probability-and-Statistics Exam
  4. WGU.Applied-Probability-and-Statistics.v2026-06-16.q53 Dumps
  • «
  • 1
  • 2
  • 3
  • 4
  • 5
  • 6
  • 7
  • 8
  • 9
  • 10
  • …
  • »
  • »»
Download Now

Question 6

In a game, a coin is tossed, and a spinner with 8 equal spaces numbered 1 through 8 is spun.
What is the probability of getting heads on the coin and a number less than 3 on the spinner?

Correct Answer: A
insert code

Question 7

Probability it does NOT rain = 1 # 0.25 = ?

Correct Answer: A
This question uses the complement rule of probability. If the probability that it rains is 0.25, then the probability that it does not rain is the complement of that event. The complement rule states that P(not A) = 1
# P(A). Here, A represents the event "it rains," so P(not rain) = 1 # 0.25 = 0.75. This means there is a 75% probability that rain does not occur. Option B repeats the probability of rain rather than its complement.
Option C would imply rain and no rain are equally likely, which is not supported by the given probability.
Option D would mean no rain is certain, but a 0.25 probability of rain means rain is still possible. The key technical point is that an event and its complement must sum to 1. Study Guide references/topics: probability, complement rule, event probability, sample-space total.
insert code

Question 8

Standard deviation measures:

Correct Answer: A
Standard deviation measures the spread, variability, or dispersion of data values around the mean. A small standard deviation indicates that the data values are clustered closely around the mean, while a large standard deviation indicates that the values are more widely dispersed. It is calculated from deviations from the mean, squared deviations, variance, and then the square root of variance. Standard deviation is not a measure of central tendency; measures of central tendency include the mean, median, and mode. It is also not a probability, although it is used in probability distributions such as the normal distribution. Frequency refers to how often a value or category occurs, which is summarized with tables, bar charts, histograms, or dot plots.
The standard deviation is essential because it quantifies how consistent or variable a dataset is. Study Guide references/topics: standard deviation, variance, spread, descriptive statistics.
insert code

Question 9

Dataset: 3, 6, 9. Median?

Correct Answer: A
The median is the middle value of a data set after the values are placed in ascending order. The dataset is 3, 6,
9, which is already ordered from least to greatest. Since there are three observations, the median is the second value, because one value lies below it and one value lies above it. Therefore, the median is 6. The median is a measure of center and is especially useful when data may be skewed or contain outliers because it depends on position rather than the magnitude of every value. The mean for this dataset is also 6, since (3 + 6 + 9) ÷ 3 =
6, but the question specifically asks for the median. Options B and C are not values in the dataset, and option D is the minimum value, not the middle. Study Guide references/topics: median, ordered data, measures of central tendency, descriptive statistics.
insert code

Question 10

The pie chart shows the contribution of different renewable energy sources to the total energy production.
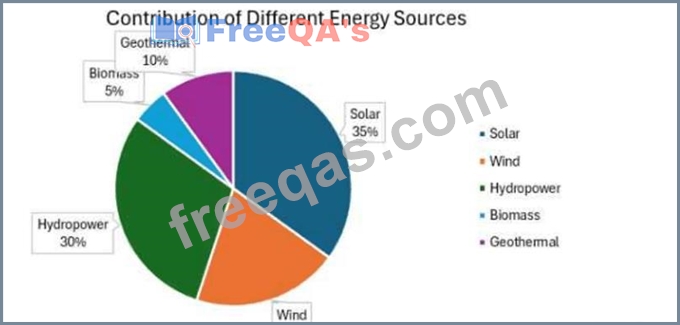
What is true about the given data?

Correct Answer: D
A pie chart displays how a whole is divided into categorical parts, usually as percentages totaling 100%. The chart shows solar at 35%, hydropower at 30%, wind at 20%, geothermal at 10%, and biomass at 5%. The largest percentage is solar, so solar power contributes the most to total energy production. Option A is false because hydropower plus biomass equals 30% + 5% = 35%, which is equal to solar, not more than solar.
Option B is false because geothermal is 10%, while biomass is only 5%; therefore, biomass contributes the least. Option C is false because biomass plus geothermal equals 5% + 10% = 15%, which is less than wind at
20%. The correct interpretation requires comparing category percentages accurately rather than relying on visual size alone. References/topics from the Study Guide: pie charts, categorical data, percentages, interpreting graphical displays.
insert code
  • «
  • 1
  • 2
  • 3
  • 4
  • 5
  • 6
  • 7
  • 8
  • 9
  • 10
  • …
  • »
  • »»
[×]

Download PDF File

Enter your email address to download WGU.Applied-Probability-and-Statistics.v2026-06-16.q53 Dumps


Email:

FreeQAs

Our website provides the Largest and the most Latest vendors Certification Exam materials around the world.

Using dumps we provide to Pass the Exam, we has the Valid Dumps with passing guranteed just which you need.

  • DMCA
  • About
  • Contact Us
  • Privacy Policy
  • Terms & Conditions
©2026 FreeQAs

www.freeqas.com materials do not contain actual questions and answers from Cisco's certification exams.