FreeQAs
 Request Exam  Contact
  • Home
  • View All Exams
  • New QA's
  • Upload
PRACTICE EXAMS:
  • Oracle
  • Fortinet
  • Juniper
  • Microsoft
  • Cisco
  • Citrix
  • CompTIA
  • VMware
  • ISC
  • SAP
  • EMC
  • PMI
  • HP
  • Salesforce
  • Other
  • Oracle
    Oracle
  • Fortinet
    Fortinet
  • Juniper
    Juniper
  • Microsoft
    Microsoft
  • Cisco
    Cisco
  • Citrix
    Citrix
  • CompTIA
    CompTIA
  • VMware
    VMware
  • ISC
    ISC
  • SAP
    SAP
  • EMC
    EMC
  • PMI
    PMI
  • HP
    HP
  • Salesforce
    Salesforce
  1. Home
  2. WGU Certification
  3. Applied-Probability-and-Statistics Exam
  4. WGU.Applied-Probability-and-Statistics.v2026-06-16.q53 Dumps
  • «
  • 1
  • 2
  • 3
  • 4
  • 5
  • 6
  • 7
  • 8
  • 9
  • 10
  • …
  • »
  • »»
Download Now

Question 11

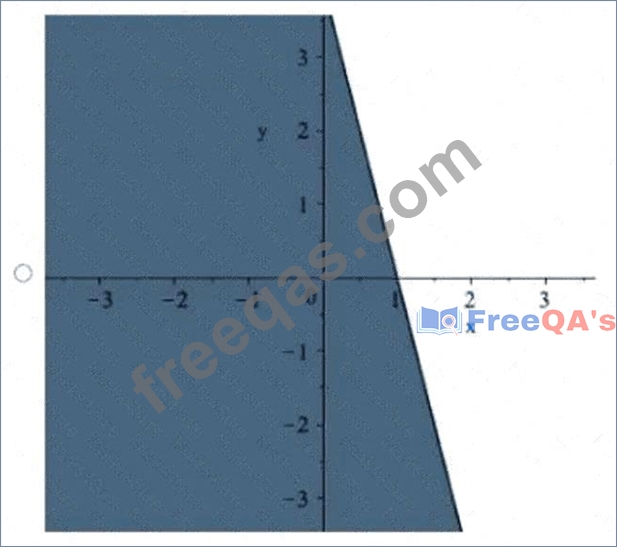
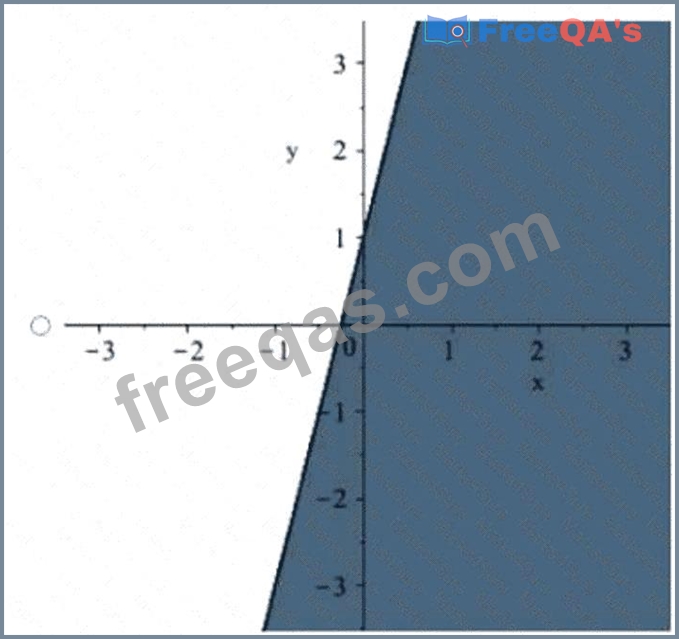
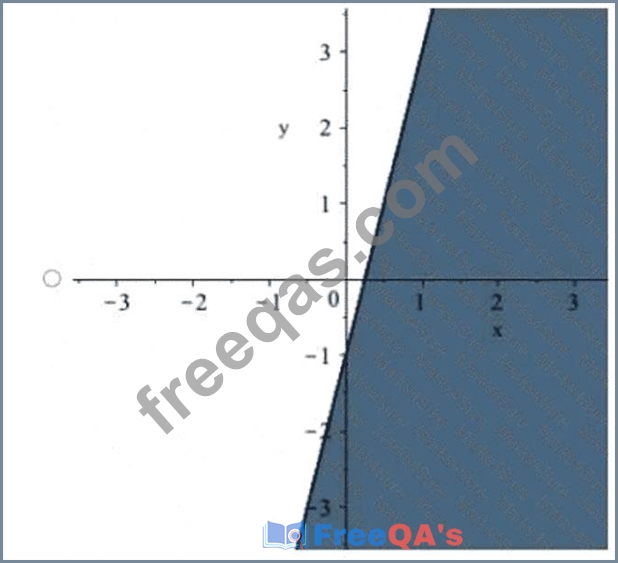
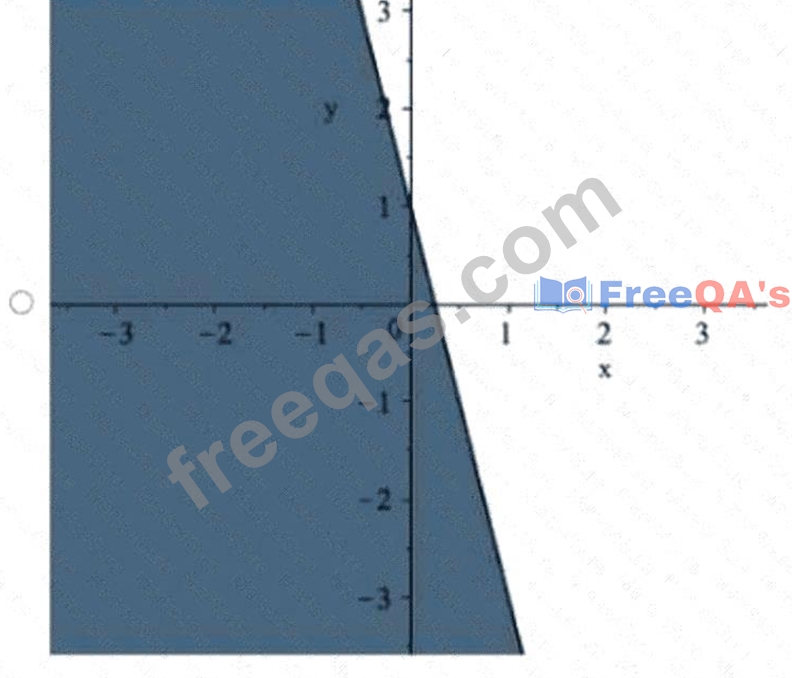
Review the following inequality:
y # #4x + 1
Which shaded region is described by this inequality?
Correct Answer: D
The inequality y # #4x + 1 has boundary line y = #4x + 1. The slope is #4, so the line must decrease steeply from left to right. The y-intercept is 1, so the line must cross the vertical axis at y = 1. Because the inequality uses "#," the boundary line must be solid, meaning points on the line are included in the solution set. The solution region must be below the line because y is less than or equal to the expression #4x + 1. A quick test point confirms this. Substitute (0, 0): 0 # #4(0) + 1, giving 0 # 1, which is true. Therefore, the shaded solution region must include the origin. Graph D shows a solid, steep downward-sloping line crossing the y-axis near 1 and shades the region containing the origin and below the boundary. References/topics from the Study Guide:
linear inequalities, slope-intercept form, boundary lines, test-point method.
insert code

Question 12

Best chart for categorical data?

Correct Answer: A
A bar chart is the best display for categorical data because it shows the frequency or relative frequency of each category using separate bars. Categorical variables classify observations into groups, such as favorite color, type of transportation, political affiliation, or product category. A bar chart allows the viewer to compare category counts directly by bar height. A histogram is not appropriate because it is used for quantitative data grouped into numerical intervals. A scatterplot is used to examine the relationship between two quantitative variables, such as height and weight. A boxplot summarizes a quantitative distribution using quartiles, median, spread, and outliers. Since the question asks specifically about categorical data, the display must preserve category labels rather than numerical intervals or continuous measurement. Therefore, the bar chart is the correct choice. Study Guide references/topics: categorical data, bar charts, frequency displays, descriptive statistics.
insert code

Question 13

A home inspector finds 3% of the homes in a community infected with termites.
How should the home inspector's findings be interpreted?

Correct Answer: C
A probability or percentage describes how often an event is expected to occur in the long run. Here, 3% of homes are infected with termites. As a probability, this is 0.03, meaning about 3 out of every 100 homes would be expected to have termites. This is a small probability, so the event should be interpreted as unlikely.
It is not impossible, because impossible would require a probability of 0%. It is also not likely, because likely events generally have probabilities substantially greater than 50%. Finally, it is not "as likely as unlikely," because that language corresponds to a probability near 50%, where occurrence and nonoccurrence are approximately balanced. Since 3% is close to zero but not equal to zero, the technically correct interpretation is that termite infection is unlikely for a randomly selected home in the community. References/topics from the Study Guide: probability interpretation, percentages, unlikely events, complementary probability.
insert code

Question 14

A school surveyed student participation in extracurricular activities. The survey found:
* The drama club had 50% of students participate.
* The science club had 30% of students participate.
* Both clubs had 15% of students participate.
What is the probability that a student participated in the drama club, given that they attended the science club?

Correct Answer: D
This question asks for a conditional probability. The phrase "given that they attended the science club" means the science club group becomes the restricted reference group. The required probability is P(drama club | science club), which is calculated as P(drama and science) divided by P(science). The problem states that 15% of students participated in both clubs, so P(drama and science) = 0.15. It also states that 30% participated in the science club, so P(science) = 0.30. Therefore, P(drama | science) = 0.15 ÷ 0.30 = 0.50. This means that among students who attended the science club, half also participated in drama club. Option A gives the joint probability, not the conditional probability. Option B gives only the science club participation rate. Option C does not match the conditional probability calculation. References/topics from the Study Guide: conditional probability, joint probability, probability ratios, two-event probability.
insert code

Question 15

Probability of drawing king or queen from deck = ?

Correct Answer: A
A standard deck contains 52 cards. There are 4 kings and 4 queens, one of each rank in each suit. The event is drawing a king or a queen. Since a single card cannot be both a king and a queen, these two events are mutually exclusive. Therefore, the number of favorable outcomes is 4 + 4 = 8. The probability is favorable outcomes divided by total outcomes: 8/52. This fraction can be simplified to 2/13, but the answer choice provides the unsimplified correct form. Option B, 4/52, counts only kings or only queens, not both. Option C,
1/13, is equivalent to 4/52 and again represents one rank only. Option D, 1/26, is too small and does not match the count of favorable cards. The word "or" signals that both qualifying ranks should be included. Study Guide references/topics: card probability, mutually exclusive events, addition rule, sample space.
insert code
  • «
  • 1
  • 2
  • 3
  • 4
  • 5
  • 6
  • 7
  • 8
  • 9
  • 10
  • …
  • »
  • »»
[×]

Download PDF File

Enter your email address to download WGU.Applied-Probability-and-Statistics.v2026-06-16.q53 Dumps


Email:

FreeQAs

Our website provides the Largest and the most Latest vendors Certification Exam materials around the world.

Using dumps we provide to Pass the Exam, we has the Valid Dumps with passing guranteed just which you need.

  • DMCA
  • About
  • Contact Us
  • Privacy Policy
  • Terms & Conditions
©2026 FreeQAs

www.freeqas.com materials do not contain actual questions and answers from Cisco's certification exams.