FreeQAs
 Request Exam  Contact
  • Home
  • View All Exams
  • New QA's
  • Upload
PRACTICE EXAMS:
  • Oracle
  • Fortinet
  • Juniper
  • Microsoft
  • Cisco
  • Citrix
  • CompTIA
  • VMware
  • ISC
  • SAP
  • EMC
  • PMI
  • HP
  • Salesforce
  • Other
  • Oracle
    Oracle
  • Fortinet
    Fortinet
  • Juniper
    Juniper
  • Microsoft
    Microsoft
  • Cisco
    Cisco
  • Citrix
    Citrix
  • CompTIA
    CompTIA
  • VMware
    VMware
  • ISC
    ISC
  • SAP
    SAP
  • EMC
    EMC
  • PMI
    PMI
  • HP
    HP
  • Salesforce
    Salesforce
  1. Home
  2. Microsoft Certification
  3. DP-600 Exam
  4. Microsoft.DP-600.v2026-10-12.q204 Dumps
  • ««
  • «
  • …
  • 19
  • 20
  • 21
  • 22
  • 23
  • 24
  • 25
  • 26
  • 27
  • 28
  • …
  • »
  • »»
Download Now

Question 111

You have a Microsoft Power Bl semantic model.
You plan to implement calculation groups.
You need to create a calculation item that will change the context from the selected date to month-to-date (MTD).
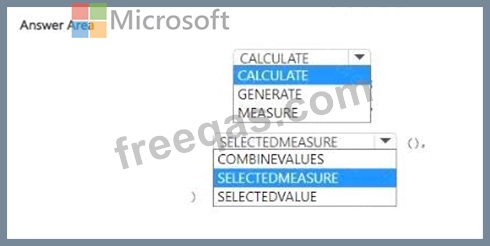
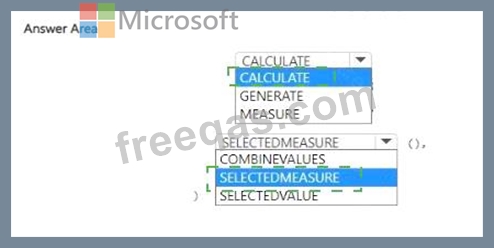
How should you complete the DAX expression? To answer, select the appropriate options in the answer area.
NOTE: Each correct selection is worth one point.
Correct Answer:

Explanation:

To create a calculation item that changes the context from the selected date to month-to-date (MTD), the appropriate DAX expression involves using the CALCULATE function to alter the filter context and the DATESMTD function to specify the month-to-date context.
The correct completion for the DAX expression would be:
* In the first dropdown, select CALCULATE.
* In the second dropdown, select SELECTEDMEASURE.
This would create a DAX expression in the form:
CALCULATE(
SELECTEDMEASURE(),
DATESMTD('Date'[DateColumn])
)
insert code

Question 112

You have a Fabric tenant that contains a warehouse named Warehouse1. Warehouse1 contains a fact table named FactSales that has one billion rows. You run the following T-SQL statement.
CREATE TABLE test.FactSales AS CLONE OF Dbo.FactSales;
For each of the following statements, select Yes if the statement is true. Otherwise, select No. NOTE: Each correct selection is worth one point.

Correct Answer:

Explanation:
* A replica of dbo.Sales is created in the test schema by copying the metadata only. - Yes
* Additional schema changes to dbo.FactSales will also apply to test.FactSales. - No
* Additional data changes to dbo.FactSales will also apply to test.FactSales. - No The CREATE TABLE AS CLONE statement creates a copy of an existing table, including its data and any associated data structures, like indexes. Therefore, the statement does not merely copy metadata; it also copies the data. However, subsequent schema changes to the original table do not automatically propagate to the cloned table. Any data changes in the original table after the clone operation will not be reflected in the clone unless explicitly updated.
References =
* CREATE TABLE AS SELECT (CTAS) in SQL Data Warehouse
insert code

Question 113

You have a Fabric tenant.
You are creating a Fabric Data Factory pipeline.
You have a stored procedure that returns the number of active customers and their average sales for the current month.
You need to add an activity that will execute the stored procedure in a warehouse. The returned values must be available to the downstream activities of the pipeline.
Which type of activity should you add?

Correct Answer: A
In a Fabric Data Factory pipeline, to execute a stored procedure and make the returned values available for downstream activities, the Lookup activity is used. This activity can retrieve a dataset from a data store and pass it on for further processing. Here's how you would use the Lookup activity in this context:
Add a Lookup activity to your pipeline.
Configure the Lookup activity to use the stored procedure by providing the necessary SQL statement or stored procedure name.
In the settings, specify that the activity should use the stored procedure mode.
Once the stored procedure executes, the Lookup activity will capture the results and make them available in the pipeline's memory.
Downstream activities can then reference the output of the Lookup activity.
insert code

Question 114

You have a Fabric workspace that uses the default Spark starter pool and runtime version 1,2.
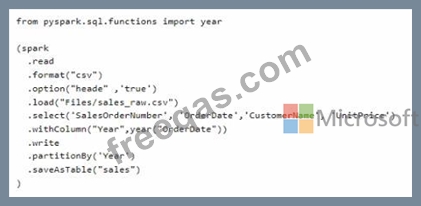
You plan to read a CSV file named Sales.raw.csv in a lakehouse, select columns, and save the data as a Delta table to the managed area of the lakehouse. Sales_raw.csv contains 12 columns.
You have the following code.
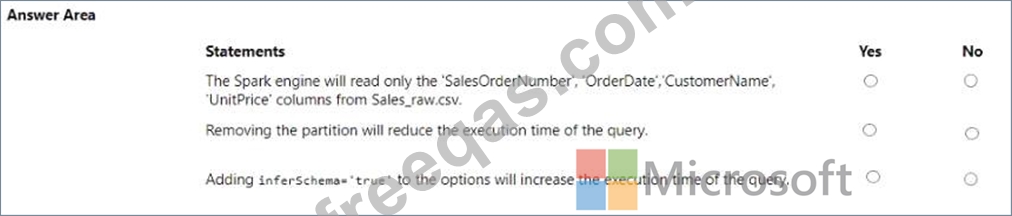
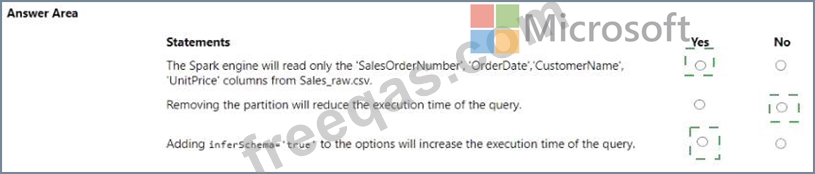
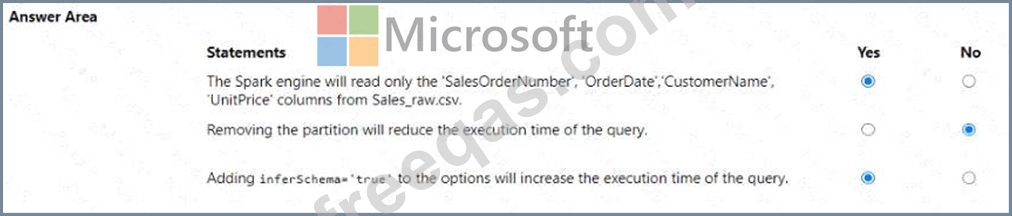
For each of the following statements, select Yes if the statement is true. Otherwise, select No. NOTE: Each correct selection is worth one point.
Correct Answer:

Explanation:

* The Spark engine will read only the 'SalesOrderNumber', 'OrderDate', 'CustomerName', 'UnitPrice' columns from Sales_raw.csv. - Yes
* Removing the partition will reduce the execution time of the query. - No
* Adding inferSchema='true' to the options will increase the execution time of the query. - Yes The code specifies the selection of certain columns, which means only those columns will be read into the DataFrame. Partitions in Spark are a way to optimize the execution of queries by organizing the data into parts that can be processed in parallel. Removing the partition could potentially increase the execution time because Spark would no longer be able to process the data in parallel efficiently. The inferSchema option allows Spark to automatically detect the column data types, which can increase the execution time of the initial read operation because it requires Spark to read through the data to infer the schema.
insert code

Question 115

You have a Fabric notebook that has the Python code and output shown in the following exhibit.


Which type of analytics are you performing?

Correct Answer: B
The Python code and output shown in the exhibit display a histogram, which is a representation of the distribution of data. This kind of analysis is descriptive analytics, which is used to describe or summarize the features of a dataset. Descriptive analytics answers the question of "what has happened" by providing insight into past data through tools such as mean, median, mode, standard deviation, and graphical representations like histograms.
References: Descriptive analytics and the use of histograms as a way to visualize data distribution are basic concepts in data analysis, often covered in introductory analytics and Python programming resources.
insert code
  • ««
  • «
  • …
  • 19
  • 20
  • 21
  • 22
  • 23
  • 24
  • 25
  • 26
  • 27
  • 28
  • …
  • »
  • »»
[×]

Download PDF File

Enter your email address to download Microsoft.DP-600.v2026-10-12.q204 Dumps

Email:

FreeQAs

Our website provides the Largest and the most Latest vendors Certification Exam materials around the world.

Using dumps we provide to Pass the Exam, we has the Valid Dumps with passing guranteed just which you need.

  • DMCA
  • About
  • Contact Us
  • Privacy Policy
  • Terms & Conditions
©2026 FreeQAs

www.freeqas.com materials do not contain actual questions and answers from Cisco's certification exams.
