FreeQAs
 Request Exam  Contact
  • Home
  • View All Exams
  • New QA's
  • Upload
PRACTICE EXAMS:
  • Oracle
  • Fortinet
  • Juniper
  • Microsoft
  • Cisco
  • Citrix
  • CompTIA
  • VMware
  • ISC
  • SAP
  • EMC
  • PMI
  • HP
  • Salesforce
  • Other
  • Oracle
    Oracle
  • Fortinet
    Fortinet
  • Juniper
    Juniper
  • Microsoft
    Microsoft
  • Cisco
    Cisco
  • Citrix
    Citrix
  • CompTIA
    CompTIA
  • VMware
    VMware
  • ISC
    ISC
  • SAP
    SAP
  • EMC
    EMC
  • PMI
    PMI
  • HP
    HP
  • Salesforce
    Salesforce
  1. Home
  2. Tableau Certification
  3. Desktop-Specialist Exam
  4. Tableau.Desktop-Specialist.v2026-05-03.q171 Dumps
  • ««
  • «
  • …
  • 10
  • 11
  • 12
  • 13
  • 14
  • 15
  • 16
  • 17
  • 18
  • 19
  • …
  • »
  • »»
Download Now

Question 66

By default, measures placed in a view are aggregated. The type of aggregation applied ______________

Correct Answer: B
By default, measures placed in a view are aggregated. Mostly you'll notice that the aggregation is SUM, but not ALWAYS.
The type of aggregation applied varies depending on the context of the view.
insert code

Question 67

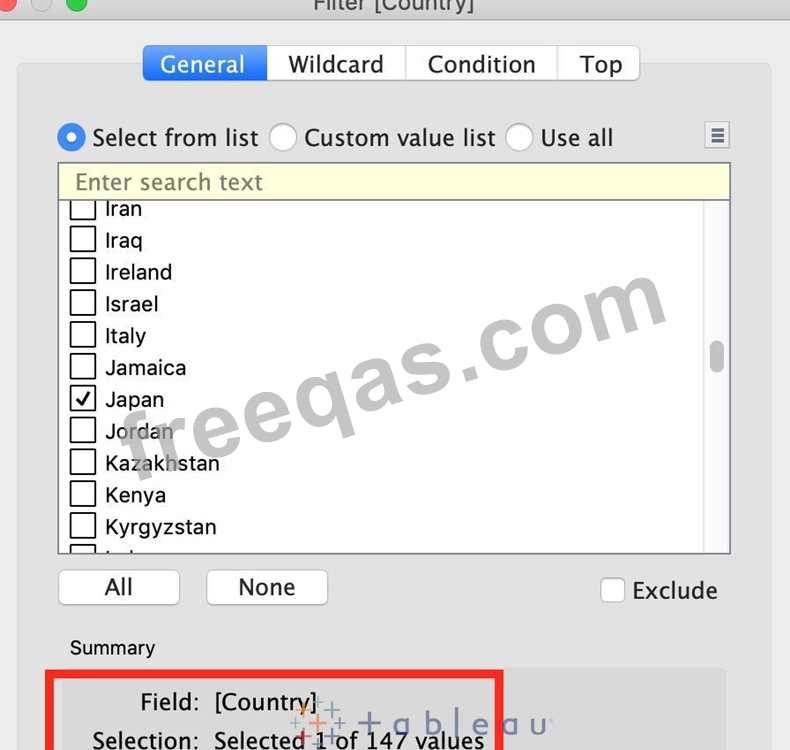
Using the dataset, create a bar chart showing the average Quantity broken down by Region, and filtered by Country to only show Japan. What was the average Quantity in the State of Tokyo?
Correct Answer: C
Explanation
Since we need to focus on 1 country -> Japan, let's filter on it first as follows:
1) Drag Country to the filter shelf, and choose only Japan. Click OK.

2) Read the Question Carefully, we need to break down the visualisation by Region, then by Country, and then by State. So let's do that:
Drag Region to the column shelf, followed by Country. Drill down into Country to include states as well.
Then drag Quantity to the Row Shelf, and change the Aggregation to AVERAGE.
The following is our visualisation:

Now that you think of it, EVEN IF YOU REMOVE THE REGION, THE ANSWER REMAINS THE SAME.
Such elements will be present in the actual exam too, just to make the question sound a little difficult, but actually it is pretty straightforward :)
insert code

Question 68

Using the CoffeeChain table, create a crosstab showing the Total Expenses per State and add Column Grand Totals to the view. Now group the states of New York, California and Washington. What percent of the total sales does this group contribute?

Correct Answer: C
Explanation
We need to use the concept of Groups for this question. Follow along:
1) First, Drag State to the Rows shelf, and Total Expenses to the Text Mark on the Marks Shelf:

2) Now, remove the SUM aggregation from Total Expenses, and add a quick table calculation -> Percent of total:

3) Next, Select the States of New York, California and Washington -> And then click the paperclip icon:

We can see the answer already : 23.386% in the view above (even before grouping!)
4) Finally, we get the following view and our answer:
insert code

Question 69

True or False: A sheet cannot be used within a story directly. Either sheets should be used within a dashboard, or a dashboard should be used within a story.

Correct Answer: B
It is possible in Tableau to use a sheet within a story directly.
Moreover, in Tableau, a story is a sequence of visualizations that work together to convey information. You can create stories to tell a data narrative, provide context, demonstrate how decisions relate to outcomes, or to simply make a compelling case.
At the same time, a story is also a collection of sheets, arranged in a sequence. Each individual sheet in a story is called a story point.
insert code

Question 70

True or False: Physical tables remain distinct (normalized), not merged in the data source whereas logical tables are merged into a single, flat table.

Correct Answer: B
In fact, the opposite of this is true.
Trick : Whenever you think of joins -> Think that after the join is created, we get 1 single flat combined (joined) table. This flat combined table is created prior to us creating our visualizations. This happens at the physical layer.
If you ever think about relationships, know that all tables will remain distinct and separate, and relationships sit at the logical layer. At run time, when you bring in the dimensions and measures to create your viz, Tableau very smartly creates the necessary joins, relates the tables and sends queries to these tables to get the resultant data back in the most meaningful way possible. This allows you to focus on using your data and revealing insights from it and focus less on the data preparation aspect!
Refer to logical layer vs physical layer from the official
documentation: https://help.tableau.com/current/server/en-us/datasource_datamodel.htm
insert code
  • ««
  • «
  • …
  • 10
  • 11
  • 12
  • 13
  • 14
  • 15
  • 16
  • 17
  • 18
  • 19
  • …
  • »
  • »»
[×]

Download PDF File

Enter your email address to download Tableau.Desktop-Specialist.v2026-05-03.q171 Dumps

Email:

FreeQAs

Our website provides the Largest and the most Latest vendors Certification Exam materials around the world.

Using dumps we provide to Pass the Exam, we has the Valid Dumps with passing guranteed just which you need.

  • DMCA
  • About
  • Contact Us
  • Privacy Policy
  • Terms & Conditions
©2026 FreeQAs

www.freeqas.com materials do not contain actual questions and answers from Cisco's certification exams.
