You need to access options to change a dimension's color palette.
In addition to the Marks card, what else can you use?
What does it imply if a field has a blue background?

Which of the following are valid ways to copy a worksheet visualisation as an image?


Using the Time Series table, create a chart that shows the percent difference in Average Inventory on Hand for each Assortment by year and quarter.
How many quarters did the Electronics Assortment show a negative percent difference in the Average Inventory On Hand?


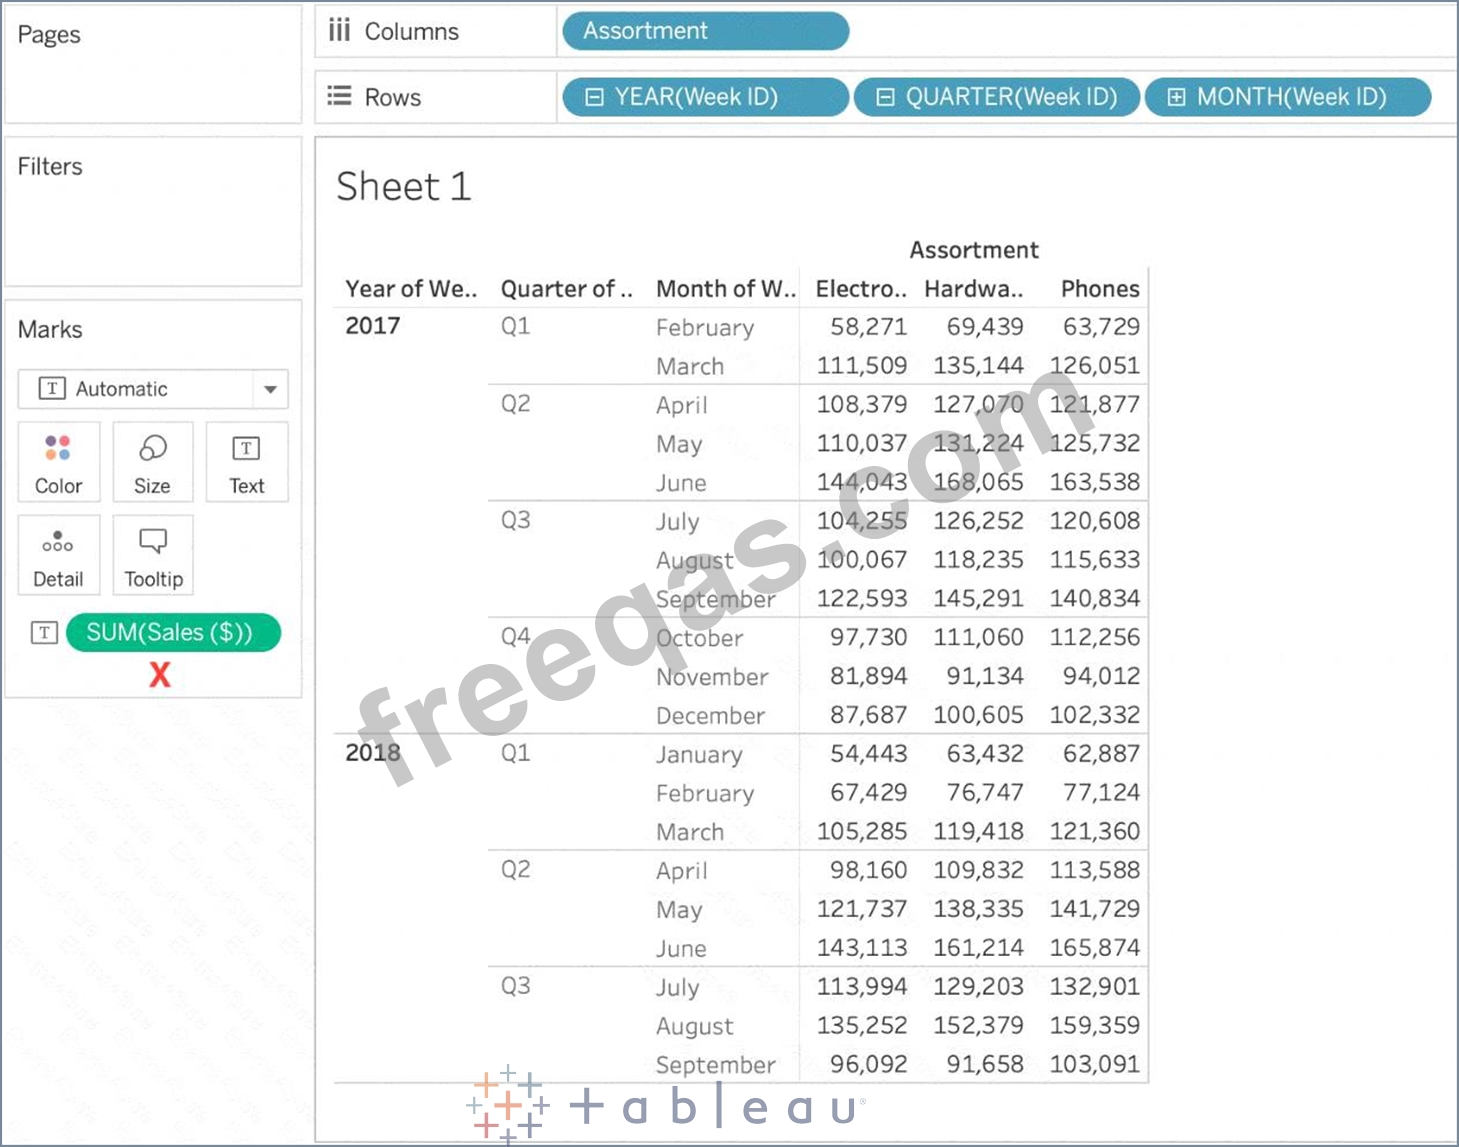
Using the Time Series table, create a cross-tab showing sales for each Assortment broken down by Year and Quarter. In Q4 of October 2017, what was the Average sales amount for the Hardware assortment?

Enter your email address to download Tableau.Desktop-Specialist.v2026-05-03.q171 Dumps

