FreeQAs
 Request Exam  Contact
  • Home
  • View All Exams
  • New QA's
  • Upload
PRACTICE EXAMS:
  • Oracle
  • Fortinet
  • Juniper
  • Microsoft
  • Cisco
  • Citrix
  • CompTIA
  • VMware
  • ISC
  • SAP
  • EMC
  • PMI
  • HP
  • Salesforce
  • Other
  • Oracle
    Oracle
  • Fortinet
    Fortinet
  • Juniper
    Juniper
  • Microsoft
    Microsoft
  • Cisco
    Cisco
  • Citrix
    Citrix
  • CompTIA
    CompTIA
  • VMware
    VMware
  • ISC
    ISC
  • SAP
    SAP
  • EMC
    EMC
  • PMI
    PMI
  • HP
    HP
  • Salesforce
    Salesforce
  1. Home
  2. Tableau Certification
  3. Desktop-Specialist Exam
  4. Tableau.Desktop-Specialist.v2026-05-03.q171 Dumps
  • ««
  • «
  • …
  • 12
  • 13
  • 14
  • 15
  • 16
  • 17
  • 18
  • 19
  • 20
  • 21
  • …
  • »
  • »»
Download Now

Question 76

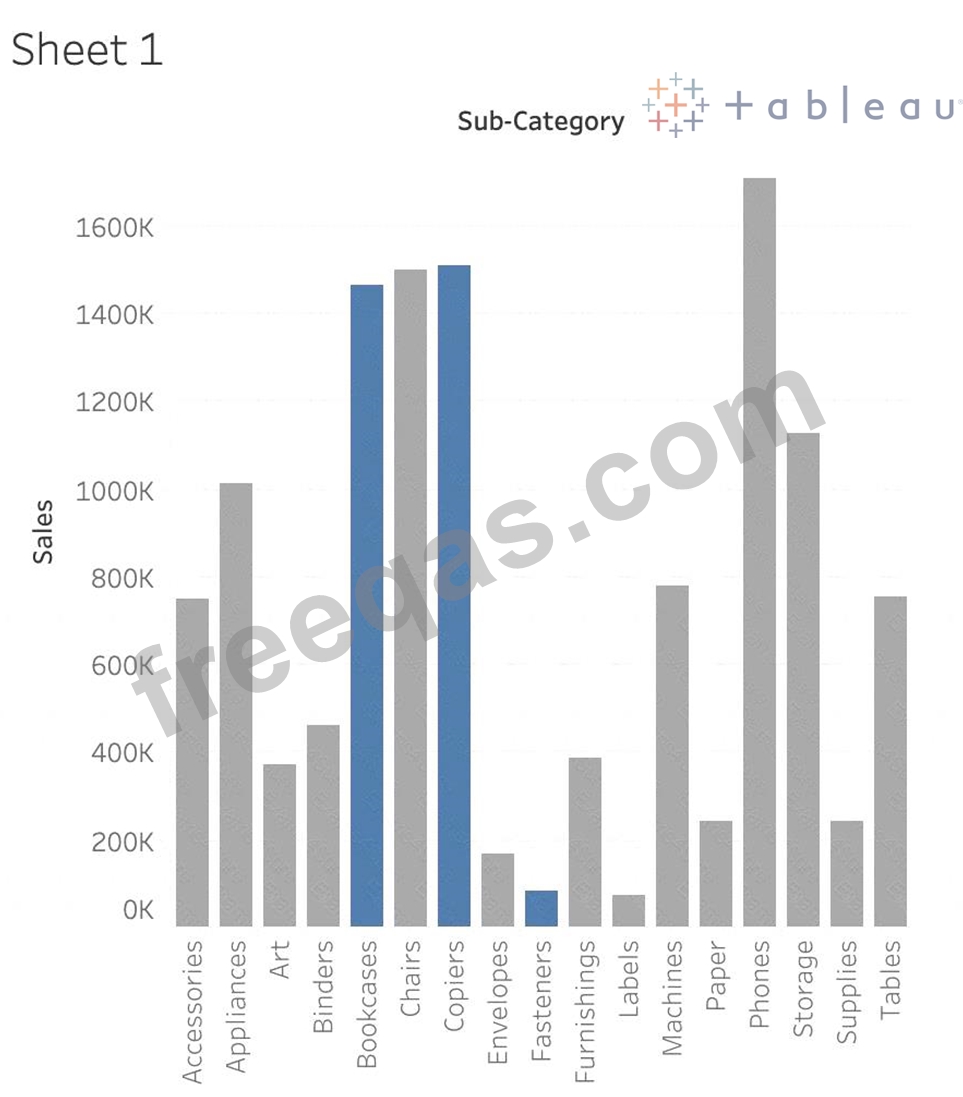
Suppose you have a bar chart. When we group by labels in a view, which of the following happens?

Correct Answer: D
*Very important question*
If we select the labels in the view and then group, a new consolidated mark is created - in our case bar since we are talking about a bar chart in the question. See below:

Then on grouping, a new bar is created, and the colour of all bars remain the same.

Had we grouped by choosing the marks instead of the labels, the following would be the result:
insert code

Question 77

True or False: Enabling any other type of sort (Field, alphabetic, or Nested) clears the manual sort we create.

Correct Answer: A
This is true. a Manual Sort lets you select a value and move it to the desired position, either by dragging it in the list or using the arrows to the right.
However, as soon as you choose some other type of sort - be it field, nested, or alphabetic, our custom created manual sort gets deleted/cleared.
insert code

Question 78

If you see a Blue field, generally it will add _____________ to the view

Correct Answer: D
Important question!
insert code

Question 79

When should you use a relationship instead of a join for two data sets?

Correct Answer: B
You should use a relationship instead of a join for two data sets when the data sets include similar data aggregated at different levels of detail. A relationship is a way of combining data from different tables based on common fields without creating a single table with all fields. A relationship allows you to query data from multiple tables as needed and preserve the level of detail of each table. A relationship is useful when you have data sets that are aggregated at different levels of detail, such as sales by region and sales by product. A relationship can match data from different levels of detail without creating null values or duplicate rows. The other options are not valid situations for using a relationship instead of a join for two data sets. The data sets include similar data aggregated up to the highest level is not correct, because a relationship is not needed when both data sets have the same level of detail. You can use either a relationship or a join in this case, depending on your preference and performance. The data sets are in two separate tables within a single spreadsheet is not correct, because a relationship is not limited by the location or format of the data sets. You can use a relationship to combine data from different sources or connections, such as databases, files, or web services.
To use both data sets across multiple sheets in a visualization is not correct, because a relationship does not affect how you use data in your visualization. You can use either a relationship or a join to create multiple sheets and dashboards with your data sets.
insert code

Question 80

At a minimum, what do you need to create a simple scatter plot?

Correct Answer: A
To create a simple scatter plot in Tableau, you need to have a measure on Columns and a measure on Rows. A scatter plot is a type of visualization that shows the relationship between two numerical variables. In Tableau, you can create a scatter plot by placing at least one measure on the Columns shelf and at least one measure on the Rows shelf. The measures can be continuous or discrete, but they must be aggregated. The marks in the scatter plot represent the intersection of the values for each measure1 The other options are not valid ways to create a simple scatter plot in Tableau. A dimension on Detail and a measure on Columns will create a bar chart, not a scatter plot. A dimension on Columns and a measure on Rows will create a line chart or an area chart, depending on the mark type. A dimension on Columns and a dimension on Rows will create a text table or a heat map, depending on the mark type1
insert code
  • ««
  • «
  • …
  • 12
  • 13
  • 14
  • 15
  • 16
  • 17
  • 18
  • 19
  • 20
  • 21
  • …
  • »
  • »»
[×]

Download PDF File

Enter your email address to download Tableau.Desktop-Specialist.v2026-05-03.q171 Dumps

Email:

FreeQAs

Our website provides the Largest and the most Latest vendors Certification Exam materials around the world.

Using dumps we provide to Pass the Exam, we has the Valid Dumps with passing guranteed just which you need.

  • DMCA
  • About
  • Contact Us
  • Privacy Policy
  • Terms & Conditions
©2026 FreeQAs

www.freeqas.com materials do not contain actual questions and answers from Cisco's certification exams.